A Brief History of Almost Everywhere
A History of the Universe, from Newgrange to the Edge of Time
Preface
This book has one subject and one promise.
The subject is the universe: what it is made of, how it began, what it contains, how far it goes and how it will end. The promise is the same one made by its companion volume. Everything between these covers can be followed by a reader who once sat a Leaving Certificate physics or chemistry paper, however many years ago, and has since let the details go. Nothing is assumed to be remembered. Every idea is built from the ground up, and where an equation appears it is set apart in a box, introduced in words, and worked through with a real example, so that a reader who skips every one of them will miss nothing essential.
What the book is not is a textbook. Textbooks teach to a syllabus and reward the dutiful; this book follows a story and rewards the curious. Its twenty-two chapters move in four parts.
Part I — Looking Up traces how human beings went from watching the sky to measuring it: from a stone passage in County Meath aligned on the midwinter sunrise, through Eratosthenes measuring the Earth with a shadow, Kepler’s six-year war with the orbit of Mars, and the discovery that the faint smudges in the sky are other galaxies, to the moment in 1965 when two engineers found the afterglow of the beginning and could not get rid of it.
Part II — The Universe We Know sets out the modern picture and the evidence for it: the first three minutes, the oldest light, the invisible matter that outweighs the visible five to one, the dark energy that is pushing the expansion faster, and the extraordinary fraction of a second at the start that seems to have set everything up. It ends with two chapters on where that picture is under strain, and what the instruments now coming online are expected to settle.
Part III — The Cosmic Menagerie turns from the universe as a whole to the things in it: the lives and deaths of stars, the neutron stars that keep better time than atomic clocks, black holes, galaxies and the web they are strung along, and the six thousand worlds now known to orbit other suns.
Part IV — Edges and Endings returns to the questions the first chapter raises. How far does the universe go, and does it end anywhere? How will it end in time, and how long will that take? And what, if anything, came before the beginning, with an honest account of where physics stops and philosophy begins.
A word about the figures. Each chapter carries between four and seven. Photographs and realistic renderings where a picture illustrates; schematic diagrams where a diagram does the conceptual work; and a set of charts drawn from real data, including the Sun’s spectrum, the light elements made in the first minutes, the notes of the early universe, the rotation curve of a spiral galaxy and twenty-five years of disagreement about the expansion rate. Labels appear only where they are needed to read the figure.
A word about the Irish thread that runs through the book. It is there because it belongs there, not out of sentiment. The story begins at Newgrange because Newgrange is genuinely an astronomical instrument, and an older one than Stonehenge. The largest telescope in the world stood for seventy years in the Irish midlands, and it was there that the spiral structure of galaxies was first seen. The catalogue numbers astronomers still use were compiled in Armagh. The first pulsar was found by a young woman from Lurgan, and the prize went to her supervisor. These are not footnotes to the history; they are part of it.
A word, finally, about what the book attempts. It tries to be serious without being dry, honest about what is known and what is not, and generous in its credit, particularly to the people whose work was credited to others at the time. It does not hide the arguments. Cosmology in 2026 is a subject with a magnificently successful standard model and at least four separate problems with it, and saying so is more interesting than pretending otherwise. Some of the frontier chapters will date faster than the rest, and they say when they were written so that the reader can calibrate.
A reader who finishes the book should be able to stand outside on a clear night, look up, and know what they are looking at: how old it is, how far it goes, what it is made of, where it came from and how it will end. They should also know exactly where that knowledge stops, and why it stops there.
Claude.ai, September 2026
Part I — Looking Up
Chapter 1 — The Light in the Passage
“I know that I am mortal and the creature of a day; but when I search out the massed wheeling circles of the stars, my feet no longer touch the earth.” — Claudius Ptolemy, c. 150 CE (trans. T. L. Heath)
The light in the passage
It is a little before nine o’clock on a December morning in County Meath, and you are standing in the dark.
Not ordinary dark: the complete, thick darkness of a stone room buried under a hill. Around you, a handful of other people shuffle and whisper. Overhead, unseen, rises a roof of great overlapping slabs, each one set a little further inward than the one below, closing to a single capstone six metres above the floor. It was built five thousand years ago, and it has kept the rain out ever since. Behind you, a narrow stone passage runs nineteen metres back towards the outside world. It is 21 December, the shortest day of the year, and everyone in the chamber is waiting for the same thing.
Then it comes. A thin line of gold appears on the floor of the passage, as though someone had laid a strip of bright ribbon on the stone. It widens. It creeps forward, climbing the gently rising floor, until it reaches into the chamber itself and lies across the ground at your feet, lighting the carved spirals on the walls in a glow the colour of honey. For about seventeen minutes the heart of the hill is full of sunlight. Then the beam narrows, retreats down the passage, and is gone. The chamber returns to darkness for another year.
This is Newgrange, in the Boyne valley, and it is one of the oldest scientific instruments in the world.
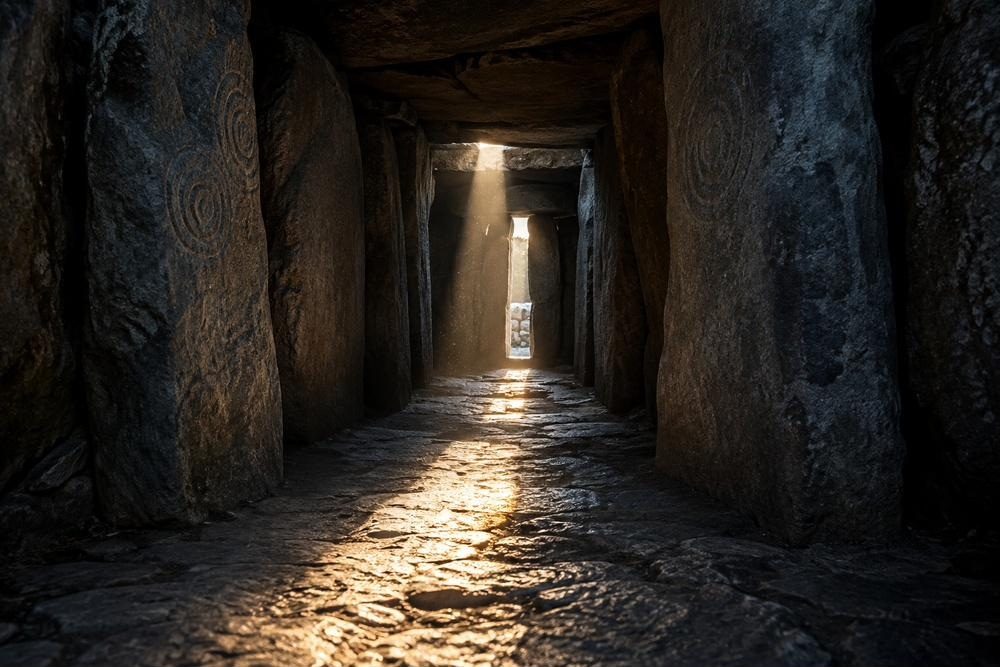
Figure F01-01. Winter solstice at Newgrange. For a few minutes each year, sunlight reaches the heart of a hill built five thousand years ago, as the builders planned.
The great mound, about eighty-five metres across, was raised around 3200 BCE, some centuries before the Great Pyramid of Giza and before the great stone circle of Stonehenge. Its builders were farmers. They had no metal tools, no writing and no wheel. What they did have was patience, and the habit of watching the sky.
The trick that makes the solstice beam possible is subtle. The passage rises as it goes in, so that the floor of the chamber sits about two metres higher than the entrance. Sunlight coming straight through the doorway would strike the passage floor long before reaching the chamber. So above the doorway the builders left a second, smaller opening, now called the roof-box. Its sole purpose is to let in a beam of light at exactly the right height and angle, on exactly the right mornings, to travel the whole length of the passage. Change the angle by a few degrees and the beam would hit the wall instead.
To build this, someone had to know precisely where on the horizon the Sun rises on the shortest day of the year. That knowledge is not obvious. It can only be gained by watching sunrise after sunrise, over many years, and marking where it happens.
KEY CONCEPT — Why the sunrise wanders
Watch the sunrise from the same spot every morning for a year and you will see it move. In summer the Sun rises far round towards the north-east; in winter it rises far round towards the south-east, climbs only a little way, and sets early. Through the year the sunrise point swings back and forth along the horizon like a slow pendulum. At each end of its swing it seems to pause for several days before turning back. These turning points are the solstices, from the Latin for “the Sun stands still”. The cause, though nobody at Newgrange could have known it, is that the Earth’s axis is tilted by about 23½ degrees. As the Earth travels around the Sun, first the northern half and then the southern half leans towards it. The leaning brings long days and a high Sun, which is summer; the leaning away brings short days and a low Sun, which is winter.
The solstice beam was forgotten for thousands of years. The mound became overgrown, then quarried for stone, and was rediscovered in 1699 when labourers taking stone for a local landowner uncovered the entrance. Local tradition held that the Sun lit the chamber at some time of year, but nobody seemed to know when. The archaeologist Michael O’Kelly, who excavated Newgrange from 1962, worked out that it must be the winter solstice. On the morning of 21 December 1967 he stood alone in the chamber and became the first person in perhaps five thousand years known to have seen the beam. Today so many people want to share the experience that places in the chamber are given out by lottery.
Why go to such trouble? We will never know exactly what the builders believed, because they left no writing. But the winter solstice is the moment when the days stop shortening and begin, very slowly, to lengthen. For people whose lives depended on the harvest, the return of the Sun was not a poetic idea. It was the difference between living and starving. A building that proved each year that the Sun was coming back must have carried enormous meaning.
It also carried knowledge, and that is what matters for this book. Newgrange shows that people five thousand years ago had noticed a regular pattern in the sky, recorded it (in stone, since they had no ink), and used it to make a prediction: on this morning, and not the ones before or after it, the light will come in. Noticing, recording, predicting: that is where the science of the universe begins.
And there is one more thing worth noticing about the beam at Newgrange. The light that fills the chamber left the surface of the Sun about eight minutes before it touched the floor. By the end of this book we will be reading light that set out more than thirteen billion years ago, and asking what came before it. The story of how we got from one to the other is the story of cosmology: the study of the universe as a whole.
Calendars in stone and clay
Newgrange was not unique. All over the ancient world, people who farmed, herded or travelled watched the sky, because the sky was the only reliable calendar they had.
In Egypt, the most important event of the year was the Nile flood, which brought water and fresh silt to the fields. The Egyptians noticed that the flood came at about the time the bright star Sirius reappeared in the dawn sky after months hidden in the Sun’s glare. They built a calendar of 365 days around it. In Britain, the builders of Stonehenge lined up their great stones on the midsummer sunrise and the midwinter sunset. In Central America, the Maya later tracked the planet Venus with astonishing precision. Different peoples, with no contact with one another, reached the same conclusion: the sky runs to rules, and the rules can be learned.
Nobody took this further than the astronomers of Babylon, in what is now Iraq. They wrote on tablets of wet clay, pressing marks into it with a cut reed and then letting it harden in the sun. Clay is humble, but it is almost indestructible, and tens of thousands of these tablets survive. From around 652 BCE, the priest-astronomers of Babylon kept a nightly record of what they saw: the positions of the Moon and planets, eclipses, weather, even the price of barley and the level of the river. They kept it up for some six hundred years, making it the longest continuous scientific record in history.
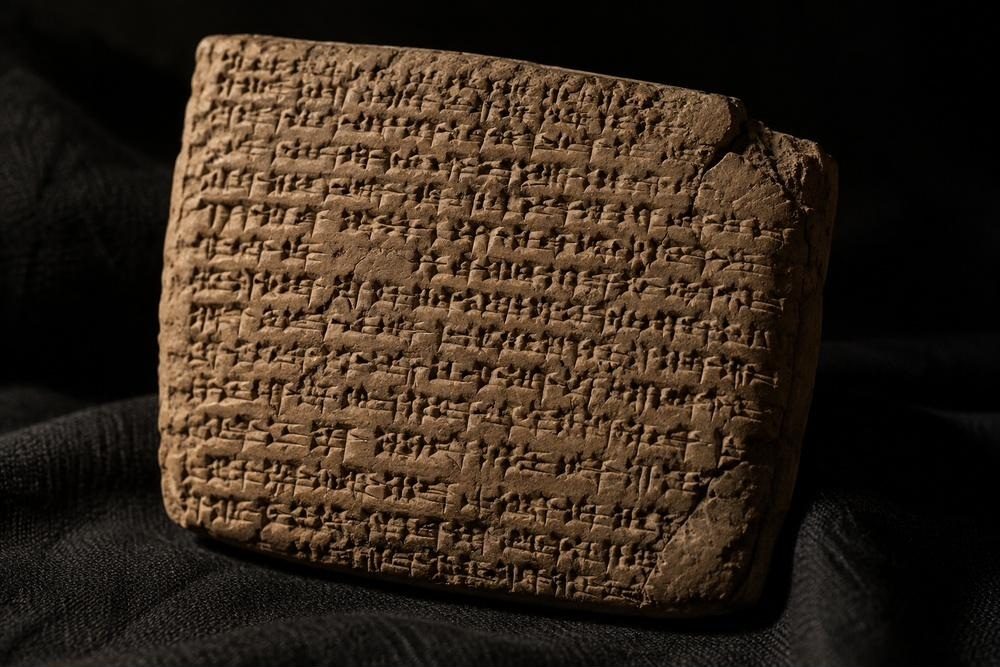
Figure F01-02. A record written in wet clay. For six centuries the astronomers of Babylon logged the night sky, and many of their tablets survive to this day.
With records that long, patterns appeared that no single lifetime could reveal. The Babylonians found, for example, that eclipses of the Moon come in a cycle lasting eighteen years and eleven days. After one cycle, the Sun, Moon and Earth return to almost the same arrangement, and the same eclipses happen again. With this, they could forecast eclipses decades ahead.
We still live with their arithmetic every day. The Babylonians counted in sixties rather than tens. That is why there are 60 minutes in an hour, 60 seconds in a minute, and 360 degrees in a circle.
Their motive was not quite what we would call science. The Babylonians believed events in the sky were omens sent by the gods, and a king who could be warned of an eclipse in advance could take precautions. Astrology, in other words, paid for astronomy. But the data were real, careful and honest, and they would be used by Greek astronomers centuries later.
What the Babylonians did not do was draw a picture. Their method was entirely arithmetic: tables of numbers that repeated in cycles, good for predicting when something would happen but silent on why. They could tell you when the Moon would be eclipsed. They did not ask what shape the Earth was, how far away the Moon might be, or what was really going on up there. Those questions came from their neighbours to the west.
The round Earth
Readers of A Brief History of Almost Nothing will already have met the thinkers of Miletus, on the coast of what is now Turkey, who around 600 BCE began asking what the world is made of. The same thinkers also asked what shape it is, and what holds it up.
Their answers were bold. Anaximander, a younger contemporary of Thales, proposed that the Earth is a short, fat cylinder, like a drum, hanging in space with nothing holding it up. It stays where it is, he suggested, because it sits at the centre of everything and has no reason to fall one way rather than another. That may sound strange, but it was a giant step. For the first time, someone had imagined the Earth floating free, surrounded on all sides by sky.
By about 500 BCE, the followers of Pythagoras had gone further and declared the Earth a sphere. Their reasons were partly mystical: the sphere was the most perfect shape, so a perfect cosmos must be built of spheres. But within a couple of centuries there was real evidence, and it was gathered by Aristotle, whose views on matter we met in the atom book.
KEY CONCEPT — How the Greeks knew the Earth is round
Aristotle, writing around 350 BCE, gave two arguments that anyone can check without leaving home. First, during an eclipse of the Moon the Earth’s shadow falls across the Moon’s face, and the edge of that shadow is always curved. Only a sphere casts a round shadow from every direction; a flat disc seen edge-on would cast a straight one. Second, travellers going south see new stars rise above the southern horizon that are never visible further north. A bright star called Canopus, for example, can be seen from Egypt but not from Greece. That only makes sense if the traveller is moving over a curved surface. Sailors added a third clue: a ship sailing away does not simply shrink to a dot but disappears hull first, as if sinking below a hill of water. The popular story that medieval people believed in a flat Earth is a myth; educated Europeans never doubted it was round.
Aristotle also built a complete picture of the universe, and it would dominate thinking for almost two thousand years. The Earth sat motionless at the centre. Around it, like the layers of an onion, turned a series of transparent, crystal-like spheres carrying the Moon, the Sun, the planets and finally the stars. Below the Moon, everything was change and decay: things were born, grew, rotted and died. Above the Moon, the heavens were perfect and eternal, made of a fifth element that never changed.
It was a beautiful, orderly system, and much of what came later can be read as a slow campaign to take it apart. But before anyone could argue with it, the Greeks did something the Babylonians never attempted. They measured it.
Measuring the world with a stick
In the third century BCE the greatest library in the ancient world stood in Alexandria, the Greek-speaking capital of Egypt. Around 245 BCE its chief librarian was a scholar named Eratosthenes. He was so good at so many subjects, from geography and mathematics to poetry and history, without being the very best at any, that his colleagues nicknamed him Beta: the second letter of the alphabet, always second place. It was an unkind joke, and history has overturned it, because Eratosthenes pulled off one of the most elegant measurements ever made.
He had heard a curious report from Syene, a town far to the south on the Nile, at modern Aswan. At noon on midsummer’s day, it was said, the Sun shone straight down to the bottom of a deep well there, and upright pillars cast no shadow at all. The Sun was directly overhead.
Eratosthenes knew that in Alexandria, at the same moment, the Sun was not directly overhead. An upright stick cast a short shadow. He measured the angle between the stick and the line of sunlight and found it to be about one-fiftieth of a full circle, a little over seven degrees.
That was all he needed. The Sun is so far away that its rays arrive at the Earth effectively parallel, like the lines on a sheet of ruled paper. If the Earth were flat, sticks in Syene and Alexandria would cast identical shadows. The only reason they differ is that the ground curves between the two towns. The difference in the shadow angle is exactly the angle between the two towns as seen from the centre of the Earth.
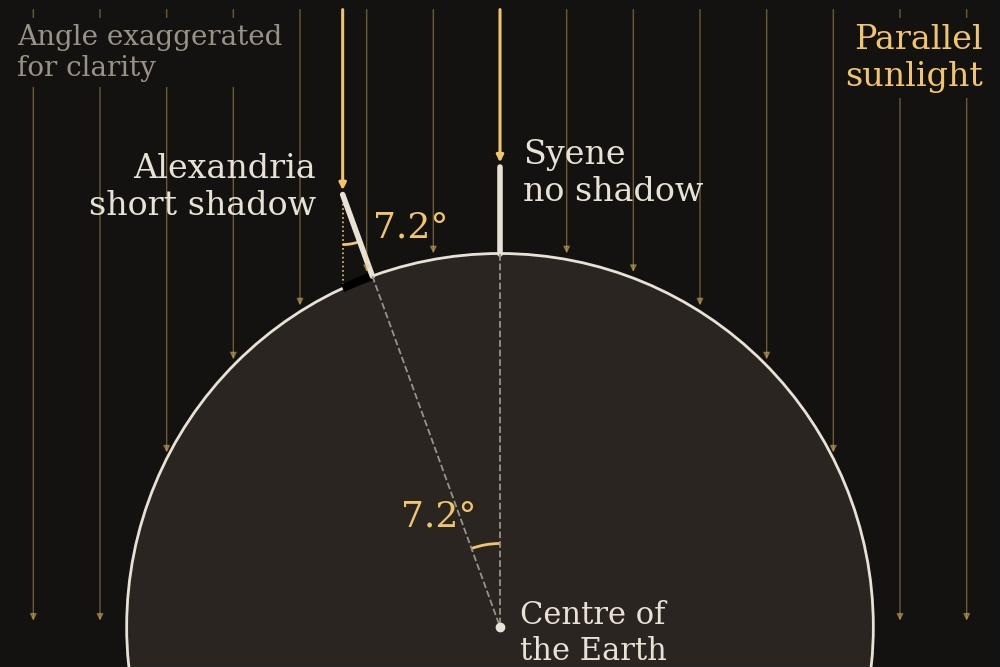
Figure F01-03. Eratosthenes’ method. Sunlight arrives in parallel rays, so the shadow angle at Alexandria equals the angle between the two towns measured at the centre of the Earth.
So the distance from Alexandria to Syene must be one-fiftieth of the way around the whole world. The distance was reckoned at about 5,000 stadia, the Greek unit of length based on the length of a stadium. Fifty times 5,000 is 250,000 stadia. That was Eratosthenes’ answer for the circumference of the Earth.
KEY CONCEPT — Eratosthenes’ sum, in plain arithmetic
A full circle is 360 degrees. The shadow at Alexandria made an angle of 7.2 degrees. Dividing 360 by 7.2 gives 50, so the two towns are one-fiftieth of the way around the Earth. Multiply the distance between them (5,000 stadia) by 50 and you have the whole circumference: 250,000 stadia. There is no algebra here, only one division and one multiplication. What makes the result brilliant is the reasoning behind the numbers, not the numbers themselves.
How close was he? That depends on exactly how long a stadion was, which historians still argue about, because different Greek cities used different stadiums. Depending on which value you take, Eratosthenes’ answer comes out at somewhere between about 39,000 and 46,000 kilometres. The true figure is just over 40,000. His measurements were rough (Syene is not quite due south of Alexandria, and the distance between them was only an estimate), but the errors partly cancelled out. Either way, someone in the third century BCE, using a stick, a shadow and some clear thinking, had measured the size of the planet to within about fifteen per cent, and possibly much closer.
It is worth pausing on what just happened, because it is the pattern of the whole book. Nobody walked around the world. Nobody could. Instead, Eratosthenes measured something small and nearby (a shadow), combined it with a sound idea (parallel rays striking a curved surface), and deduced something enormous and far away. Every measurement of the universe since, from the distance to the Sun to the age of the cosmos, has worked the same way.
The man who moved the Sun
If the size of the Earth could be measured, perhaps the Moon and Sun could be too. A generation before Eratosthenes, an astronomer named Aristarchus of Samos tried exactly that, and where his reasoning led him was so far ahead of its time that it would take nearly two thousand years for the world to catch up.
His method for the Sun was ingenious. When the Moon is exactly half lit, as seen from Earth, the Sun must be shining on it from precisely the side. At that moment the Earth, Moon and Sun form a right-angled triangle, with the right angle at the Moon. If you then measure the angle between the Moon and the Sun as seen from Earth, simple geometry gives you the shape of the whole triangle, and so how much further away the Sun is than the Moon.
Aristarchus measured the angle as 87 degrees and concluded that the Sun was about eighteen to twenty times further away than the Moon. The true angle is almost 90 degrees, a difference of about a sixth of a degree, far too small to be measured by eye. That makes the true answer nearer 400 times. His method was perfect; his instruments simply could not measure precisely enough to use it.
But even his underestimate led somewhere startling. The Sun and Moon look almost exactly the same size in the sky, which is why the Moon can just cover the Sun in a total eclipse. If the Sun is twenty times further away, it must also be twenty times wider. Aristarchus then used the width of the Earth’s shadow during a lunar eclipse to compare the Moon with the Earth. Putting everything together, he found that the Sun must be several times wider than the Earth, and so hundreds of times greater in volume. (The true figures are about 109 times wider and more than a million times greater in volume.)
Now Aristarchus asked the obvious question. Why should something so huge go around something so small? Surely it made more sense for the small Earth to travel around the great Sun. And so, around 270 BCE, he proposed that the Sun stands still at the centre, and the Earth circles it once a year while spinning on its axis once a day.
His book on the subject is lost. We know about his Sun-centred idea mainly because Archimedes, the greatest mathematician of the age, mentioned it in passing in a work about counting grains of sand. And almost nobody accepted it. That was not simple prejudice. There were good scientific objections.
The first was that we feel no motion. If the Earth spins once a day, a point on the equator is moving at well over a thousand kilometres an hour. Surely there would be a constant gale, and a stone thrown upwards would land far to the west? (The answer, that everything on Earth shares the Earth’s motion, needed physics that would not exist until Galileo and Newton.)
The second objection was even stronger, and it is worth understanding, because it will return in chapter 3. Hold a finger up at arm’s length and look at it first with one eye closed and then the other. The finger seems to jump against the background. That shift is called parallax, and it happens whenever you look at a nearby object from two different positions. If the Earth really swung around the Sun, we would view the stars from opposite sides of a huge circle every six months, and the nearer stars should shift against the more distant ones. Nobody could see any such shift.
Aristarchus had an answer: the stars must be so enormously far away that the shift is too small to see. He was right. But an idea that can only survive by assuming the universe is unimaginably larger than anyone believed was a hard sell, and the parallax of the stars would not be measured until 1838. Like Democritus with his atoms, Aristarchus had the right idea with no way to prove it.
Wheels within wheels
The real test of any picture of the heavens was the planets. The Greek word planetes means “wanderers”, because five bright points of light (Mercury, Venus, Mars, Jupiter and Saturn) refuse to stay fixed among the stars. Night by night they drift slowly eastward against the background. Occasionally, they do something stranger still. Mars, for example, slows down, stops, reverses and travels backwards for a couple of months, then stops again and resumes its eastward journey, tracing a loop across the sky.
A universe of simple circles centred on the Earth cannot produce loops. So the astronomers who followed Aristotle added more circles.
The greatest of them was Hipparchus, who worked on the island of Rhodes around 150 BCE. He compiled a catalogue of about 850 stars with their positions and brightness, and by comparing his measurements with records made a century and a half earlier, he discovered that the whole pattern of the sky slowly shifts, a wobble in the Earth’s axis that takes about 26,000 years to complete. The Greeks represented this kind of geometry with the armillary sphere, a model of the heavens made of nested rings.
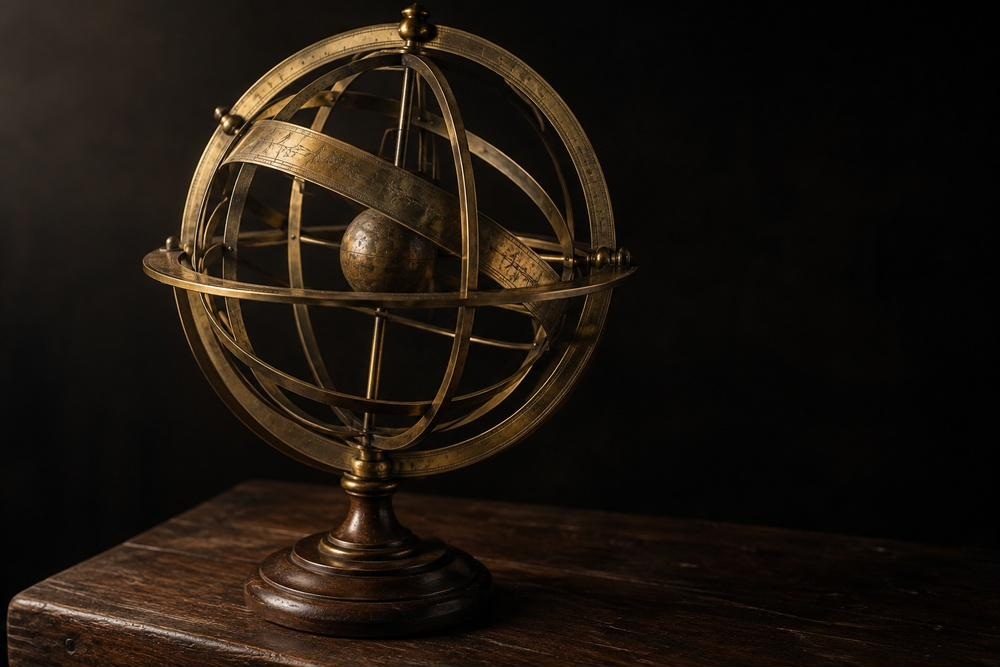
Figure F01-04. An armillary sphere, a model of the heavens made from rings, with the Earth fixed at the centre. For nearly two thousand years this was what the universe looked like.
Three centuries later, around 150 CE, the astronomer Claudius Ptolemy of Alexandria gathered everything into one great book. We know it by the name Arabic scholars later gave it: the Almagest, meaning “the greatest”. In it, each planet rides on a small circle called an epicycle, whose centre is carried around the Earth on a larger circle. Think of a fairground ride where each car spins on its own small turntable while the whole platform turns: seen from the middle, a rider sometimes moves forwards quickly and sometimes swings backwards. That is exactly how Ptolemy made Mars loop. To match the observations more closely he added further refinements, including an off-centre point around which each planet’s motion looked even. None of it was simple. But it worked.
That is the most important thing to understand about Ptolemy’s universe. It was wrong, but it was not stupid. It predicted the positions of the planets well enough to be useful for calendars, navigation and astrology for some fourteen hundred years, longer than almost any scientific theory before or since. And it teaches a lesson that runs through the rest of this book: a theory can make good predictions and still be a false picture of reality. With enough adjustable circles you can match almost any motion. Accuracy alone does not prove you have understood what is really going on.
Ptolemy’s cosmos had an edge. In a later book he estimated the distances of the planets by stacking their spheres snugly one inside the next, and placed the outermost sphere, carrying the stars, at about twenty thousand times the radius of the Earth. That sounds vast, about 130 million kilometres. But the real distance from the Earth to the Sun is about 150 million kilometres. Ptolemy’s entire universe, stars and all, would fit comfortably inside the Earth’s orbit.
Keeping the flame
As the Roman Empire in the west declined, much of Greek learning faded from Europe. It did not disappear. It moved east, and it was preserved and extended in the Islamic world for the next six centuries.
In ninth-century Baghdad, the caliphs founded a great centre of scholarship later known as the House of Wisdom, where Greek works were translated into Arabic. Ptolemy’s book was among the most prized, and so it became the al-majisti, which Europe later borrowed back as Almagest. The astronomers of the Islamic world did not simply copy it. They checked it against the sky. Al-Battani, working in what is now Syria around 900 CE, measured the length of the year and the slow wobble of the sky more accurately than Ptolemy had.
In 964 CE the Persian astronomer Abd al-Rahman al-Sufi published his Book of Fixed Stars, a beautifully illustrated revision of Ptolemy’s star catalogue. In it he noted a faint smudge of light in the constellation of Andromeda, which he called a “little cloud”. It was the first written record of an object that, as we will see in chapter 5, turned out to be an entire galaxy of stars lying far beyond our own. Nobody would understand what al-Sufi had seen for almost a thousand years.
The legacy is written across the sky. Many of the brightest stars still carry Arabic names: Aldebaran (“the follower”), Betelgeuse, Rigel, Deneb, Vega. So does some of the language of astronomy: zenith and nadir both come from Arabic.
The most important instrument of the age was the astrolabe, a flat brass disc engraved with a map of the sky and fitted with rotating plates and a sighting rule. With it, a trained user could tell the time by day or night, find the height of a star, work out when the Sun would rise, or determine the direction of Mecca for prayer. It was, in effect, a pocket computer made of brass.

Figure F01-05. The astrolabe, a brass computer for the sky. Perfected in the Islamic world, it could tell the time, track the stars and predict the sunrise.
Islamic astronomers also began to question Ptolemy’s machinery itself. At the observatory of Maragha, in what is now north-western Iran, Nasir al-Din al-Tusi devised in the 1200s an ingenious arrangement of two circles, one rolling inside another, that turns circular motions into a straight back-and-forth line. It let astronomers rebuild Ptolemy’s models without his awkward off-centre points. A century later Ibn al-Shatir of Damascus produced planetary models that are, in their geometry, strikingly like those Copernicus would publish two hundred years later, and historians think it likely that Copernicus knew of this work, though how is still debated. In the 1420s, in Samarkand, the prince-astronomer Ulugh Beg built an observatory with a giant curved instrument set into the ground and produced the first major new star catalogue since Ptolemy’s.
From the twelfth century onwards, this whole body of knowledge flowed back into Europe, much of it through translators working in Spain, where the Almagest was rendered into Latin from Arabic in 1175. By 1500 every university in Europe taught Ptolemy’s astronomy, polished and improved by six centuries of Islamic scholarship.
The universe in 1500
Pause, then, at the start of the sixteenth century and take stock.
Humanity had come a very long way since the builders of Newgrange marked the midwinter sunrise. The Earth was known to be a sphere, and its size had been measured with a stick and a shadow. The sky had been charted, its cycles recorded over centuries, and the motions of the planets reduced to a mathematical machine that could predict where each would be years ahead. Eclipses could be forecast. Instruments of brass could tell the time from the stars.
And the question at the heart of this book, where does it all end?, had a clear and confident answer. The universe was a closed, finite set of nested spheres with the Earth at its centre. It ended at the sphere of the fixed stars, a little over a hundred million kilometres away. Beyond that there was nothing at all, or there was heaven, depending on whom you asked. It was a universe on a human scale, made for us, with us at its middle.
It was also wrong in almost every important respect. The Earth was not at the centre. The heavens were not perfect or unchanging. The stars were not fixed to a sphere, and the universe did not end where Ptolemy said it did. The idea that would begin to unravel it all had already been proposed, by Aristarchus, and dismissed for good reasons. What would change everything was not a better argument but a slow accumulation of better measurements, and the first move came from a cautious churchman in a small cathedral town on the Baltic coast, who waited until he was dying before he dared to publish.
Chapter 2 — Moving the Earth
“In the middle of everything sits the Sun.” — Nicolaus Copernicus, On the Revolutions of the Heavenly Spheres, 1543
The reluctant revolutionary
In the spring of 1543, in the small cathedral town of Frombork on the Baltic coast of Poland, an old man lay dying. Nicolaus Copernicus was seventy years old and had suffered a stroke. According to a story told by a friend, the first printed copy of his life’s work was brought to his bedside on the day he died, 24 May, and placed in his hands. Whether or not he was still able to understand what he was holding, the book was finally out in the world. He had kept it back for more than thirty years.
Copernicus was not a professional astronomer in the modern sense. He was a canon of Frombork cathedral, a senior churchman responsible for the cathedral’s lands and finances. He had studied law and medicine in Italy, treated patients, advised on currency reform and helped defend the town against invading knights. Astronomy was his great private passion, pursued in the hours he could spare from administration.
Around 1514 he wrote a short handwritten summary of a startling idea and circulated a few copies among friends. The idea was Aristarchus’ idea from eighteen centuries earlier: the Sun, not the Earth, sits at the centre, and the Earth is a planet like the others, travelling around the Sun once a year and spinning on its axis once a day. Then, for three decades, he worked quietly on the mathematics needed to turn the idea into a complete system, and published nothing.
Why the delay? Partly because he was a perfectionist, and the mathematics was genuinely hard. Partly, it seems, because he feared ridicule. An Earth that raced through space and spun like a top contradicted common sense, Aristotle’s physics and, some argued, passages of Scripture. It took a young mathematician from Germany, Georg Joachim Rheticus, who arrived in Frombork in 1539 and stayed for two years as his only student, to persuade the old man to let the full work be printed. It appeared in Nuremberg as De revolutionibus orbium coelestium, “On the Revolutions of the Heavenly Spheres”.
The book opened with an unsigned preface, which readers naturally assumed was by Copernicus. It told them not to take the system too seriously: it was merely a mathematical convenience for calculating planetary positions, and need not be true. In fact it had been added by the Lutheran theologian Andreas Osiander, who oversaw the printing and was trying to protect the book from controversy. Copernicus almost certainly did not approve it. He believed the Earth really moved.
What Copernicus got right, and wrong
It is easy to imagine that the Sun-centred system was obviously better and that only prejudice held it back. It was not so simple.
Copernicus still believed, like every astronomer since Plato, that the heavens must move in perfect circles at steady speeds. To match the observations with circles alone, he was forced to add small circles riding on larger ones, just as Ptolemy had. His system was no simpler to calculate with than Ptolemy’s, and it predicted the positions of the planets no more accurately. An astronomer in 1550 comparing the two on the only test that mattered in practice, getting the numbers right, would have found little to choose between them.
What the new system did offer was something subtler: it made sense. Ptolemy’s model was a collection of separate machines, one for each planet, with no connection between them. Copernicus’ model tied them into a single system, and two things fell out of it naturally.
The first was the backwards loops of the planets. In a Sun-centred system, Mars appears to reverse direction simply because the Earth, on its faster inside track, overtakes it. It is the same effect you see when you overtake a slower car on the motorway: for a few moments it seems to slide backwards against the distant hills, although it is still moving forwards. Ptolemy had to build the loops in by hand; Copernicus got them for free.
The second was a scale. Ptolemy could say nothing about how far each planet was from us compared with the others. Copernicus could. Because Venus never strays far from the Sun in our sky, its orbit must lie inside the Earth’s, and the widest angle it reaches tells you how big that orbit is. Using this kind of geometry, Copernicus worked out the distance of every planet from the Sun in units of the Earth’s own distance. His answers (Venus at about 0.72, Mars 1.5, Jupiter 5.2, Saturn 9.2) are close to the values in modern textbooks. For the first time, the solar system had a shape.
Few people read the book closely, and fewer still accepted its central claim. Its tables were useful, and astronomers happily borrowed them while ignoring the moving Earth. The old objections still stood: we feel no motion, and the stars show no parallax. Copernicus answered the second exactly as Aristarchus had, by saying that the stars must be immeasurably far away. That answer quietly broke the cosy universe of chapter 1. If the stars are that far off, the cosmos is vastly bigger than anyone had imagined, and the English astronomer Thomas Digges, publishing a popular account of the Copernican system in 1576, took the next step. His diagram showed the stars scattered outwards without limit instead of fixed to a sphere. The universe, he suggested, might have no edge at all.
Nobody could yet decide between the systems, because nobody had observations good enough. The next step needed a man with the best eyes, the best instruments and the most money in Europe.
The nobleman with the metal nose
Tycho Brahe was born in 1546 into one of the most powerful noble families in Denmark, and he never let anyone forget it. He was proud, extravagant and quarrelsome. As a twenty-year-old student he fought a duel with a fellow Danish nobleman, reportedly after an argument over a point of mathematics, and lost part of his nose to a sword stroke. For the rest of his life he wore a replacement made of metal, held on with paste. Tradition says it was gold and silver; when his remains were examined in 2010, traces on the skull suggested that the one he wore every day was brass.
His passion was the sky, and in particular the conviction that astronomy’s tables were not good enough. As a teenager he had watched a close meeting of Jupiter and Saturn in 1563 and found that the best tables, both Ptolemy’s and Copernicus’, got the date wrong by days or even weeks. The problem, he decided, was not the theories but the data. Nobody had ever measured the sky carefully enough, for long enough, to test them properly.
On the evening of 11 November 1572, walking home, Tycho looked up and saw a star where no star should be. In the constellation Cassiopeia, a familiar W-shape of stars, blazed a new point of light brighter than Venus. He could hardly believe it and called on his servants and some passing peasants to confirm that they could see it too.
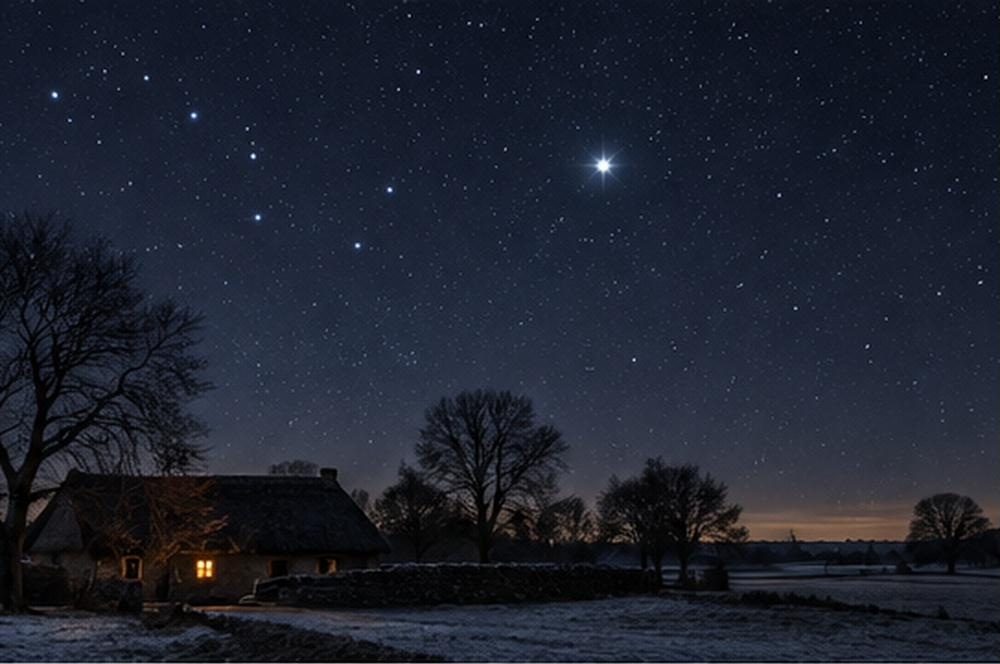
Figure F02-01. The new star of 1572. A light that appeared in an unchanging heaven, and did not move against the other stars, told Tycho that the heavens could change.
According to Aristotle, the heavens above the Moon were perfect and eternal. New things could not appear there, so a “new star” must really be something close by, in the changeable air below the Moon. Tycho tested this. If the object were as close as the Moon, it would shift slightly against the background stars as the Earth turned through the night and his viewpoint changed, in the same way that your finger jumps when you look at it with one eye and then the other. The Moon shows exactly this kind of shift. The new star did not. It lay far beyond the Moon, among the stars themselves. The perfect, unchanging heavens had changed.
(We now know what Tycho saw: a supernova, a white dwarf star exploding thousands of light-years away. We will meet such explosions again in chapter 11, where they turn out to be the key to measuring the expansion of the universe.)
Five years later, in 1577, a great comet appeared. Tycho measured that too and found it was also far beyond the Moon. Worse for the old picture, its path carried it straight through the region where the crystal spheres carrying the planets were supposed to be. Either the comet was smashing through solid spheres, or there were no spheres. Tycho concluded there were none. The planets moved freely through empty space.
The King of Denmark, Frederick II, was so impressed by his brilliant young nobleman that he gave him the island of Hven, between Denmark and Sweden, together with the rents of its farms, to build an observatory. What Tycho built there was the world’s first great scientific research institute. Uraniborg, his castle of the heavens, had living quarters, a library, a chemical laboratory, a printing press and a paper mill to supply it. When the wind made the instruments shake, he built a second observatory, Stjerneborg, with the instruments sunk below ground level for stability. He employed a team of assistants and kept careful records of every measurement, night after night, for more than twenty years.
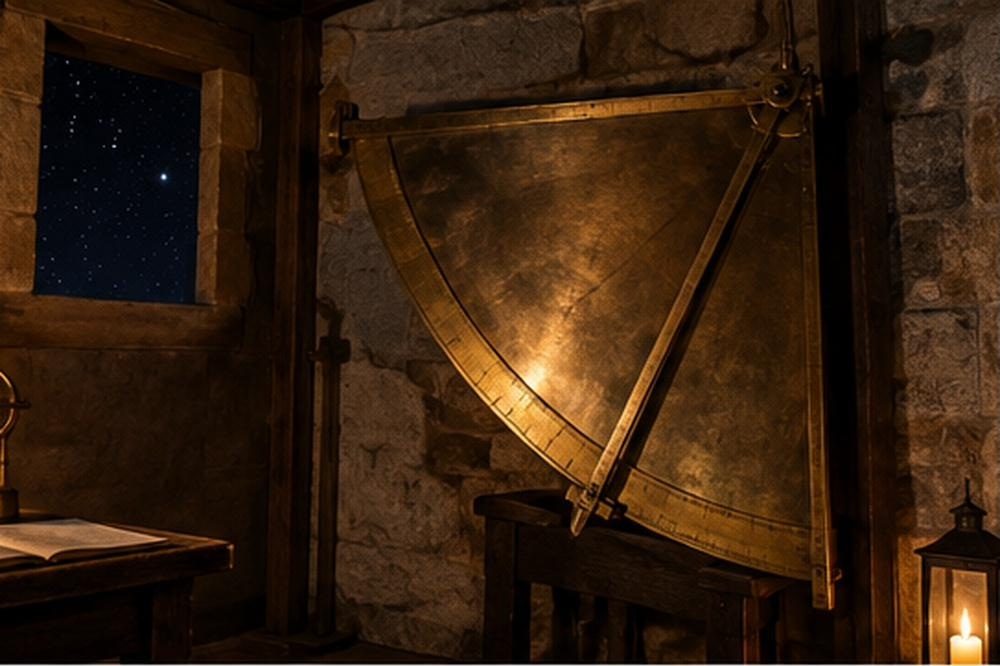
Figure F02-02. Tycho’s great wall quadrant. Before the telescope, accuracy came from size: the bigger the instrument, the finer the scale that could be marked on it.
This was all before the telescope. Tycho’s instruments were sighting devices, measuring angles by eye, and the key to accuracy was size. His great mural quadrant was a brass arc about two metres in radius, fixed to a wall that ran exactly north to south; stars were timed as they crossed it. The larger the arc, the more finely its scale could be divided. Tycho’s best measurements were accurate to about one-thirtieth of the width of the full Moon, several times better than anything achieved before. They were the finest measurements ever made with the naked eye, and they would never be improved on, because within a decade of his death the telescope made the naked eye obsolete.
Tycho never accepted the Copernican system. He could not believe that the heavy, sluggish Earth could move, and he could see no parallax in the stars. So he proposed a compromise: the Earth stays fixed at the centre, the Sun and Moon go around it, and all the other planets go around the Sun. It matched the observations just as well as the other two systems. For several decades it was the most popular choice among astronomers, because it kept the Earth still while borrowing the good sense of Copernicus.
After Frederick died, Tycho’s arrogance lost him royal favour, and in 1597 he left Denmark. He settled in Prague as imperial mathematician to the Holy Roman Emperor, Rudolf II, bringing his instruments and, above all, his precious records. There he took on a new assistant: a poor, sickly, brilliant German schoolteacher named Johannes Kepler.
Kepler’s war with Mars
The two men could hardly have been less alike. Tycho was a rich, confident aristocrat who dined in style. Kepler, born in 1571, came from a troubled family (his father was a mercenary soldier who abandoned them; his mother would later be tried as a witch). He had poor eyesight from childhood smallpox, a restless mind, and a mystical conviction that God had built the universe on mathematical principles that human beings could discover.
As a young teacher he had already published a book arguing that the spacing of the planets in the Copernican system followed from the five perfect solid shapes of Greek geometry, nested one inside the other. The idea was beautiful and wrong. But it showed Kepler’s two great strengths: he was a committed Copernican, and he was obsessed with finding the physical reasons why planets moved as they did, not merely a scheme of circles that happened to fit.
Tycho, jealous of his data, gave Kepler a single task: work out the orbit of Mars. Mars was the hardest planet, the one whose motion fitted circles least well. Kepler cheerfully predicted it would take him eight days. It took him about six years, a struggle he called his war with Mars.
Then, in October 1601, Tycho died suddenly after a banquet, and Kepler inherited his post and, after a tussle with Tycho’s family, his observations. For the first time, the best data in the world were in the hands of someone with the mathematical genius to use them.
Kepler tried every combination of circles he could think of. After immense labour he found one that matched Tycho’s positions for Mars to within eight minutes of arc, about a quarter of the width of the full Moon. Any earlier astronomer would have been delighted. Ptolemy’s own figures were rarely that good. But Kepler knew that Tycho’s measurements were accurate to within about two minutes. An error of eight could not be blamed on the observations. The circles had to be wrong. Kepler later wrote that those eight minutes alone had pointed the way to the complete reform of astronomy.
So, reluctantly, he let go of the circle, the shape that had ruled astronomy for two thousand years. After many more false starts, he found the answer. The orbit of Mars is an ellipse.
KEY CONCEPT — What an ellipse is
Push two pins into a board, tie a loop of string loosely around them, and pull the loop tight with a pencil. Keeping the string taut, draw a line all the way round. The result is an ellipse, a stretched circle. The two pins are its foci (the singular is focus). If the pins are close together the ellipse is nearly a circle; if they are far apart it is long and thin. A circle is simply an ellipse whose two foci sit on top of each other. Planetary orbits are ellipses with the Sun at one focus and nothing at all at the other. Most are very nearly circular: the orbit of Mars is so close to a circle that if you drew it on this page you could hardly tell the difference by eye. That is why the difference took the best observations in history, and six years of calculation, to find.
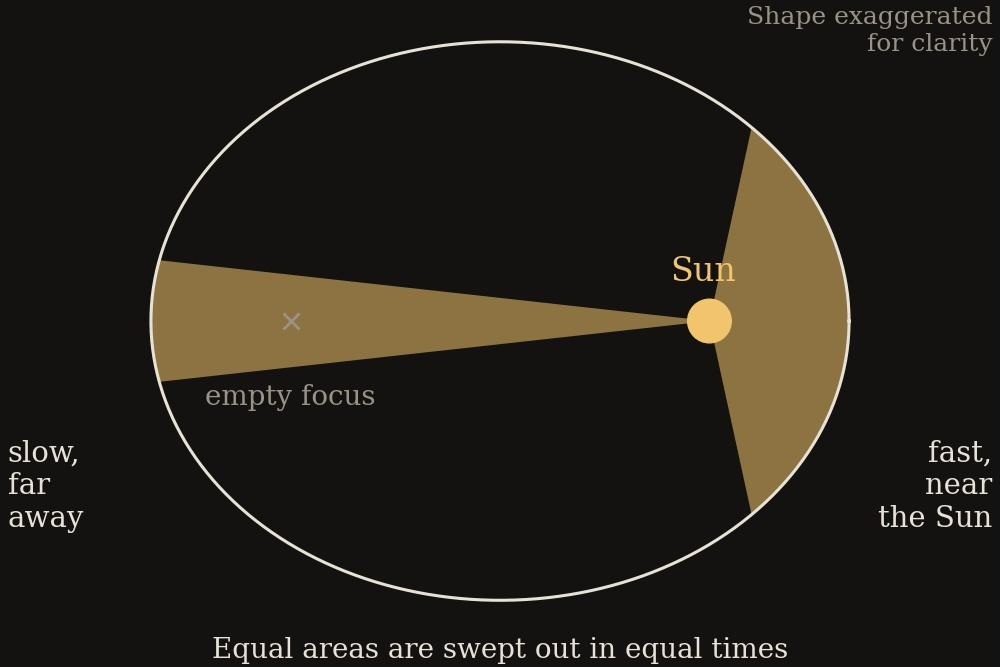
Figure F02-03. Kepler’s first two laws. Each planet moves on an ellipse with the Sun at one focus, and sweeps out equal areas in equal times, moving fastest when closest to the Sun.
In his book Astronomia Nova, the “New Astronomy” of 1609, Kepler published two laws. First, each planet moves in an ellipse with the Sun at one focus. Second, a line from the Sun to the planet sweeps out equal areas in equal times. In plain terms, a planet speeds up as it swings close to the Sun and slows down when it is far away, in a precise and predictable way.
That second law was a clue that something physical was happening. Kepler guessed that the Sun must be pushing the planets around, with some force that weakens with distance. He was wrong about the details (he imagined something like magnetism sweeping them along) but right that the Sun was controlling the planets through a physical influence. He had turned astronomy from geometry into physics, from describing the heavens to asking what makes them move. The answer would come from Newton, in the next chapter.
Ten years later, in 1619, Kepler found a third law, which he had searched for through twenty years of numerical trial and error. It connects how far each planet is from the Sun with how long it takes to go around.
THE EQUATION — Kepler’s third law
Measure each planet’s year in Earth years, and its average distance from the Sun in units of the Earth’s distance (so the Earth scores 1 on both). Then Kepler’s third law says: the planet’s year, multiplied by itself, equals its distance multiplied by itself and then by itself again. In symbols, P² = a³, where P is the time for one orbit and a is the average distance.
Try it for Jupiter, which lies about 5.2 times further from the Sun than we do. Multiply 5.2 by itself three times: 5.2 × 5.2 × 5.2 is about 140.6. So Jupiter’s year multiplied by itself must also be about 140.6, which means its year is the number that multiplies by itself to give 140.6. That number is about 11.9. Jupiter should take nearly twelve years to go around the Sun, and it does. For Mars, at 1.52 times the Earth’s distance, the same sum gives about 1.9 years; the real figure is 1.88. The law says the outer planets are not only further away but slower too, and exactly how much slower.
In 1627 Kepler published the Rudolphine Tables, named after his late emperor and built on Tycho’s observations and his own laws. They were dramatically more accurate than anything before: errors that had been as large as several degrees shrank by a factor of about thirty. That was the practical test, and the Sun-centred system, in Kepler’s form, finally passed it. He even predicted that Mercury would cross the face of the Sun in November 1631, and a French astronomer watched it happen, close to the predicted time. Kepler did not live to see it; he had died a year earlier.
The starry messenger
While Kepler was fighting with Mars in Prague, a professor of mathematics at Padua, in northern Italy, heard a rumour that changed everything. In 1608 a spectacle-maker in the Netherlands had applied for a patent on a tube with two lenses that made distant things look nearer. Galileo Galilei, then forty-five years old, worked out how such a device must work and, in the summer of 1609, built his own. He ground his own lenses and within months had an instrument that magnified about twenty times.
Galileo was not the first to point a telescope at the sky; the English mathematician Thomas Harriot sketched the Moon through one a few months before him. But he was the first to look systematically, understand what he was seeing, and tell the world about it quickly and brilliantly. What he saw in the winter of 1609–10 demolished the old picture of the heavens piece by piece.

Figure F02-04. A telescope of Galileo’s time. With little more than two spectacle lenses in a tube, it showed more of the universe in a single winter than all previous human history had seen.
He turned it first on the Moon. Aristotle’s Moon was a perfect, polished heavenly sphere. Galileo’s was rough, with mountains, craters and plains, a world rather like the Earth. By measuring the lengths of the shadows cast by lunar mountains as the sunlight struck them, he estimated their heights and found that some were several kilometres high.
He turned it on the Milky Way, the faint band of light that arches across the night sky, and found that it dissolved into countless individual stars, far too faint to see with the naked eye. The universe held vastly more than anyone had ever seen.
Then, on 7 January 1610, he turned it on Jupiter and noticed three small “stars” lying in a straight line close to the planet. The next night they had moved, but not in the way they should have if they were distant stars. Over the following nights he found a fourth, and watched them shuffle back and forth from one side of Jupiter to the other. There was only one explanation. They were moons, going around Jupiter.
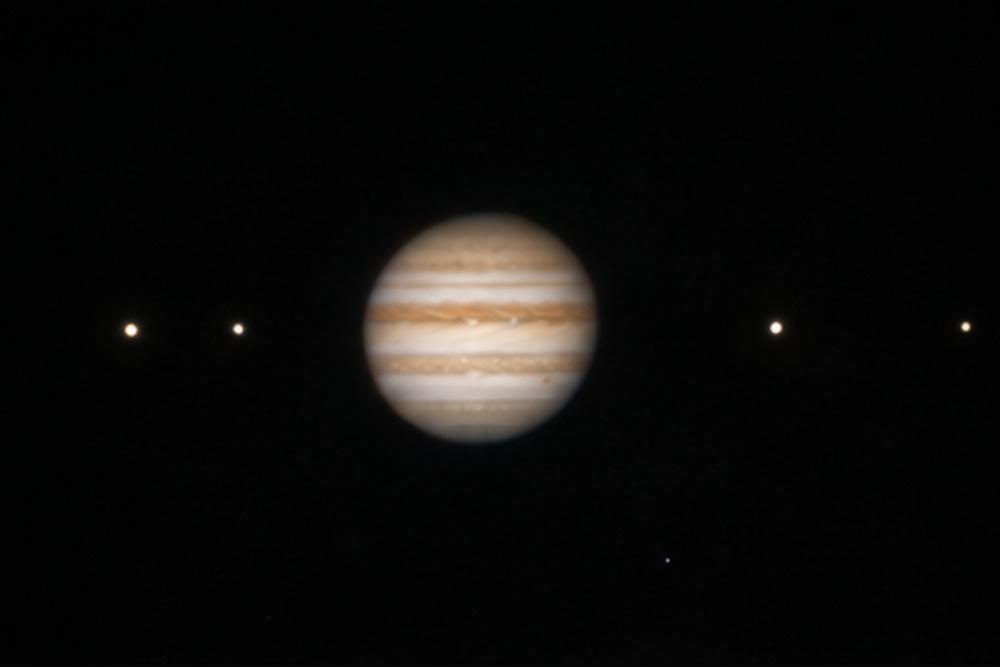
Figure F02-05. Jupiter and its four large moons as a small telescope shows them. Here was a system that plainly did not go around the Earth.
This mattered enormously. One of the strongest arguments against a moving Earth was that the Moon would be left behind: how could the Earth carry its Moon along as it raced around the Sun? Yet here was Jupiter, which everyone agreed was moving, carrying four moons with it. And here, for the first time, were bodies that certainly did not orbit the Earth. The Earth was not the centre of all motion.
Galileo rushed his discoveries into print. His short book Sidereus Nuncius, “The Starry Messenger”, appeared in March 1610, only two months after he first saw Jupiter’s moons. It made him famous across Europe almost overnight. With an eye to his career, he named the moons the Medicean Stars in honour of the powerful Medici family of Florence, and was promptly given a well-paid post as their court philosopher. Kepler, in Prague, read the book, confirmed the discovery with a borrowed telescope and wrote an enthusiastic reply.
Later in 1610, Galileo made what was perhaps the most decisive observation of all. He watched Venus over several months and saw it go through a complete set of phases, from a thin crescent to an almost full disc, just like the Moon. It also changed size dramatically, looking large when it was a crescent and small when it was nearly full.
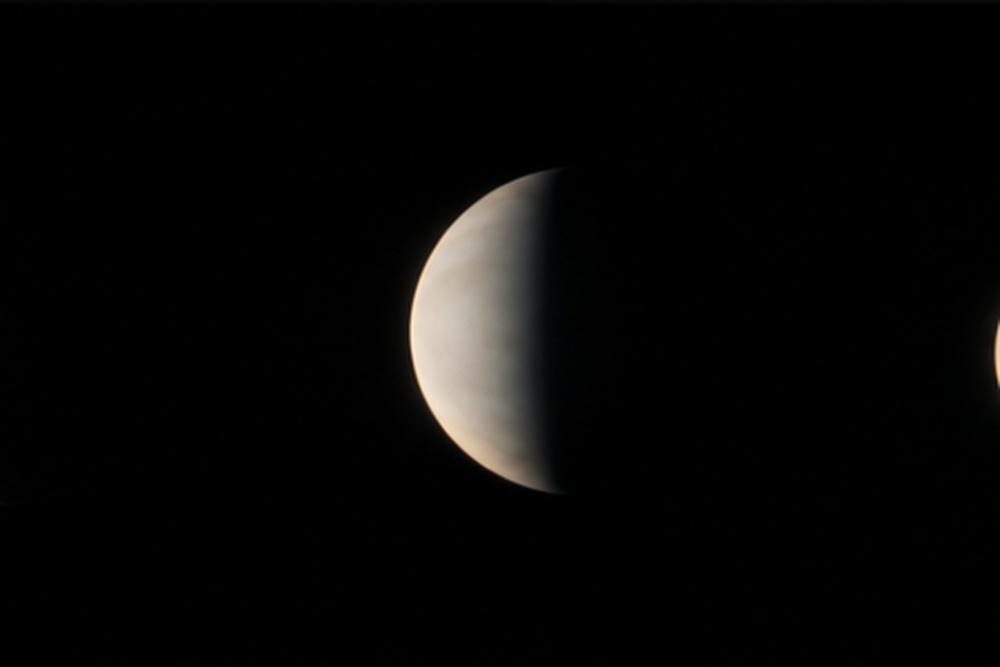
Figure F02-06. The phases of Venus. A large crescent when close, a small full disc when far away: exactly what a planet circling the Sun inside the Earth’s orbit must show.
In Ptolemy’s system, Venus always lies between the Earth and the Sun, so it could only ever show us its dark side edged with a crescent. It could never appear full. In a Sun-centred system, Venus goes right round the Sun: when it is on the far side we see its fully lit face, small because it is far away, and when it swings round towards us we see a large, thin crescent. That is exactly what Galileo saw. Ptolemy’s system was finished.
It is worth being honest about one thing, though. The phases of Venus did not prove Copernicus right, because Tycho’s compromise system, with the planets circling a Sun that itself circles a fixed Earth, predicts exactly the same phases. What finally settled the question between Copernicus and Tycho was not a single observation but the accumulating power of Kepler’s laws, and ultimately Newton’s physics, which showed why a small Earth must circle a massive Sun and not the other way round. Science rarely advances by a single knockout blow. More often, one explanation simply keeps working better than its rivals, until nobody sensible defends the alternatives any more.
The trial
Galileo was brilliant, combative and fond of ridiculing his opponents, and he became increasingly outspoken in his support of Copernicus. That brought him into conflict with the Catholic Church, whose authorities were anxious about anything that seemed to contradict Scripture at a time when the Protestant Reformation was tearing Europe apart.
In 1616 the Church declared the idea of a moving Earth to be contrary to Scripture, and Copernicus’ book was placed on the list of prohibited books “until corrected”. Galileo was warned not to hold or defend the idea. For some years he kept relatively quiet. Then, in 1632, with a new pope who had once been his friend and admirer, he published a Dialogue Concerning the Two Chief World Systems. It was presented as a balanced discussion between supporters of Ptolemy and Copernicus, but it was nothing of the kind. The Copernican speaker had all the best arguments; the defender of the old system was called Simplicio and was made to look foolish. Worse, some of the pope’s own favourite arguments were put into Simplicio’s mouth.
In 1633 Galileo, now nearly seventy, was tried by the Roman Inquisition, found “vehemently suspected of heresy”, and forced to kneel and renounce his belief that the Earth moves. The story that he muttered Eppur si muove (“and yet it moves”) as he rose is almost certainly a later legend. He spent the rest of his life under house arrest in his villa at Arcetri, near Florence. He was not idle. Going blind, he wrote his most important scientific book, on the physics of motion and the strength of materials, which was smuggled out and published in the Netherlands. It laid essential foundations for Newton.
Galileo died in January 1642. Isaac Newton was born on Christmas Day of the same year. More than three centuries later, in 1992, Pope John Paul II formally acknowledged that the Church had been wrong to condemn him.
Where things stood in 1642
A century after Copernicus’ death, the universe had been transformed.
The Earth was no longer the fixed centre of everything but one of several planets circling the Sun. The planets moved not on circles within circles but on ellipses, following three precise mathematical laws. The heavens were not perfect and unchanging: new stars appeared, comets flew through where the crystal spheres should have been, the Moon had mountains and the Sun, Galileo had found, had dark spots that came and went. The Milky Way was a multitude of stars, and the possibility that the stars stretched outwards forever, as Digges had drawn them, was being taken seriously. The universe was no longer a cosy set of nested spheres with an edge a hundred million kilometres away. Nobody now knew where it ended, or whether it ended at all.
But one great question remained unanswered. Why did the planets obey Kepler’s laws? What invisible hand held them to the Sun, and why ellipses rather than circles? Kepler had guessed that some force from the Sun was responsible, and Galileo had begun to work out how things move on Earth. The man who would join the two together, showing that the force that makes an apple fall is the same force that holds the Moon and planets in their paths, was a baby born into a Lincolnshire farmhouse that Christmas Day.
Chapter 3 — The Clockwork Heavens
“If I have seen further it is by standing on the shoulders of Giants.” — Isaac Newton, letter to Robert Hooke, 1675
The apple and the Moon
In the summer of 1665 the plague reached Cambridge, the university closed, and a twenty-two-year-old student went home to his mother’s farm at Woolsthorpe in Lincolnshire. Isaac Newton spent most of the next two years there, and in that time, by his own later account, he worked out the mathematics of change that we now call calculus, discovered that white light is a mixture of colours, and began to think seriously about gravity.
The apple story is not a myth, although it has been improved in the retelling. Newton told it to several people in his old age: sitting in the garden, he saw an apple fall, and it occurred to him to wonder how far the pull of the Earth extended. The apple did not need to hit him on the head. The important part is the question he asked next, which nobody had asked before. If the Earth’s pull reaches to the top of the tallest tree, why should it not reach all the way to the Moon?
Suppose it does. The Moon, then, is not being carried along by a crystal sphere or pushed by some heavenly force. It is falling, continuously, towards the Earth, exactly as the apple falls. It never arrives because it is also travelling sideways, fast. The combination of falling and sideways motion bends its path into a circle.
KEY CONCEPT — Why an orbit is a permanent fall
Newton later explained this with a thought experiment. Imagine a cannon on top of an impossibly high mountain, firing horizontally. Fire it gently and the ball curves down and lands a few miles away. Fire it harder and it lands further off. The Earth’s surface, meanwhile, is curving away beneath it. Fire the ball hard enough and the curve of its fall exactly matches the curve of the Earth: the ball keeps falling, but the ground keeps dropping away by the same amount, so it never lands. It has gone into orbit. Astronauts float not because there is no gravity up there (at the height of the space station, gravity is nearly as strong as it is on the ground) but because they and their spacecraft are falling together, endlessly, around the Earth.
Newton then did the arithmetic. The Moon is about sixty times further from the centre of the Earth than we are on the surface. If gravity weakens with distance in a particular way, namely with the square of the distance, then at the Moon it should be about one three-thousand-six-hundredth as strong as it is here (because sixty multiplied by itself is 3,600). Was the Moon’s fall towards us that gentle? He checked it against the known size of the Moon’s orbit and the length of the month, and, as he put it, found the answer to “answer pretty nearly”.
THE EQUATION — Newton’s law of gravity
Every object in the universe attracts every other object. The strength of the pull grows with the masses involved and weakens with distance, in a very simple way: the force is proportional to the two masses multiplied together, divided by the distance multiplied by itself.
The important part is the distance. Double the distance and the pull drops not to a half but to a quarter. Treble it and the pull drops to a ninth. This is called an inverse-square law, and it is worth remembering, because the same pattern turns up for the brightness of stars in chapter 4 and will be used to measure the universe.
An example. The Moon is 60 times further from the Earth’s centre than you are. So the Earth’s pull on a kilogram of Moon rock is 60 × 60, or 3,600 times weaker than its pull on a kilogram of you. That gentle pull, and nothing else, keeps an object the size of a small continent circling us every month.
The book that explained the heavens
Newton, being Newton, told nobody. He was secretive, thin-skinned and easily distracted, and he set the problem aside for nearly twenty years while he pursued alchemy, theology and university politics.
In August 1684 the astronomer Edmond Halley travelled to Cambridge with a question. Halley, along with Christopher Wren and Robert Hooke, had been arguing in London about what shape of orbit an inverse-square force would produce, and none of them could prove it. Halley asked Newton. Newton replied at once that it would be an ellipse, because he had calculated it. Asked for the proof, he searched his papers and could not find it, so he worked it out again and sent it on.
Halley realised what he was dealing with and spent the next three years coaxing, flattering and organising Newton into writing the whole thing down. He also paid for the printing out of his own pocket when the Royal Society ran short of money, having just spent its funds on a lavishly illustrated book about fish.
The result, published in 1687, was Philosophiæ Naturalis Principia Mathematica, the “Mathematical Principles of Natural Philosophy”, usually just called the Principia. It is one of the most important books ever written.
It begins with three laws of motion, and they are worth stating in plain words, because everything else rests on them. The first says that a thing left alone keeps doing what it is doing: at rest it stays at rest, and in motion it keeps moving in a straight line at a steady speed forever. This is not obvious on Earth, where friction and air stop everything sooner or later, and it is why the Greeks thought that continuous motion needs a continuous push. The second says that a push changes motion, and that the same push moves a heavy object less than a light one. The third says that pushes always come in pairs: if you push on something, it pushes back on you just as hard, which is why a gun recoils and a rocket flies.
Notice what the first law does to the old question about the planets. If motion needs no cause, then nobody has to explain why the planets keep going. What needs explaining is why they do not travel in straight lines but curve. Motion is free; bending is what requires a force. That reversal is the beginning of modern physics.
Newton then adds the law of universal gravitation, and shows that together the four explain, in one stroke:
- why objects fall, and at what rate
- why the Moon stays in orbit
- why the planets obey all three of Kepler’s laws, ellipses and equal areas and the relation between distance and year, which now follow as mathematical consequences rather than mysterious rules
- why the tides rise twice a day, pulled by the Moon and Sun
- why the Earth is slightly flattened at the poles by its own spin
- why the axis of the spinning Earth slowly wobbles, the precession that Hipparchus had discovered eighteen centuries earlier
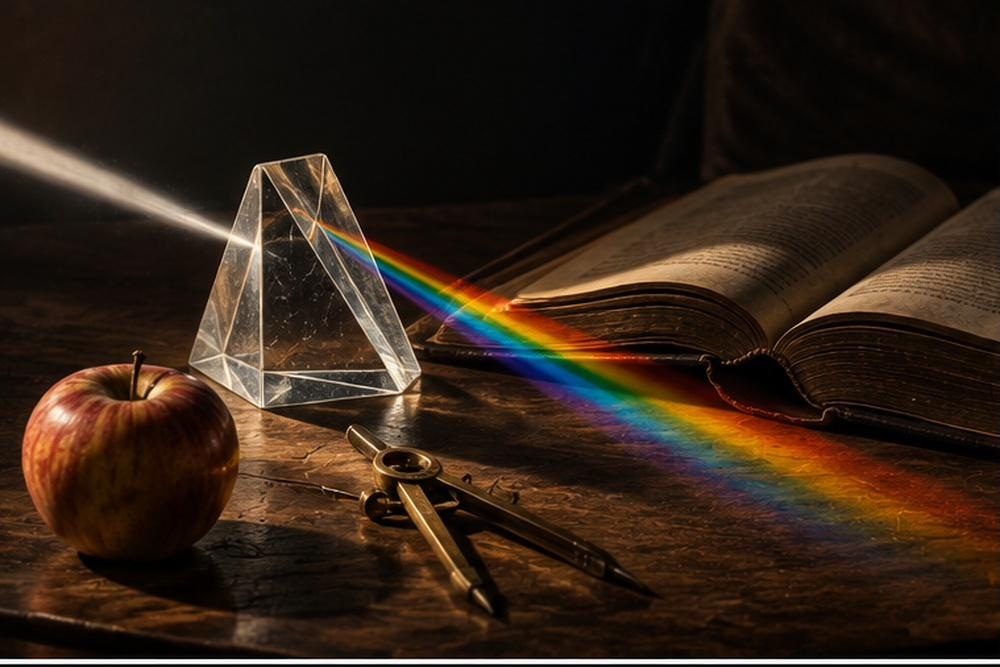
Figure F03-01. Newton’s two great insights of the plague years: white light is a mixture of colours, and the force that pulls an apple down also holds the Moon in its orbit.
The word universal is the heart of it. Aristotle’s cosmos had one set of rules for the corrupt world below the Moon and another for the perfect heavens above. Newton abolished the distinction. One law, written in ordinary mathematics, governs a falling apple, a cannonball, the Moon, the planets, the comets and, as far as anyone could tell, everything else. The universe was a machine running on knowable rules. That single idea is the foundation of everything in this book. Without it, cosmology, the study of the universe as a whole, would be impossible: you cannot reason about the behaviour of the whole universe unless you believe that the same physics applies everywhere in it.
Newton himself was careful about what he had not explained. He had described how gravity acts, with great precision, but he had no idea what gravity is, or how the Sun can pull on the Earth across a hundred and fifty million kilometres of empty space with nothing in between. He disliked the idea intensely and refused to guess publicly. Two and a half centuries later, Einstein would answer him, in chapter 6.
The comet that came back
Halley did more for Newton’s theory than pay for the book. He gave it its first spectacular public test.
Comets had always been the least predictable things in the sky, appearing without warning and treated for centuries as omens of disaster. Halley gathered every reliable historical record he could find and calculated the orbits of two dozen of them using Newton’s methods. He noticed that the comets of 1531, 1607 and 1682 followed almost identical paths, and that the gaps between them were about seventy-six years. These were not three comets, he concluded, but one, on a long, stretched ellipse that brings it close to the Sun and then carries it out beyond the orbit of Saturn.
In 1705 he predicted its return around 1758. He knew he would not live to see it; he died in 1742, aged eighty-five. On Christmas night 1758 a German farmer and amateur astronomer named Johann Palitzsch found the comet exactly where it should be, and it swung past the Sun in March 1759, slightly later than Halley’s first estimate but close to a revised calculation that allowed for the pull of Jupiter and Saturn on the way in.
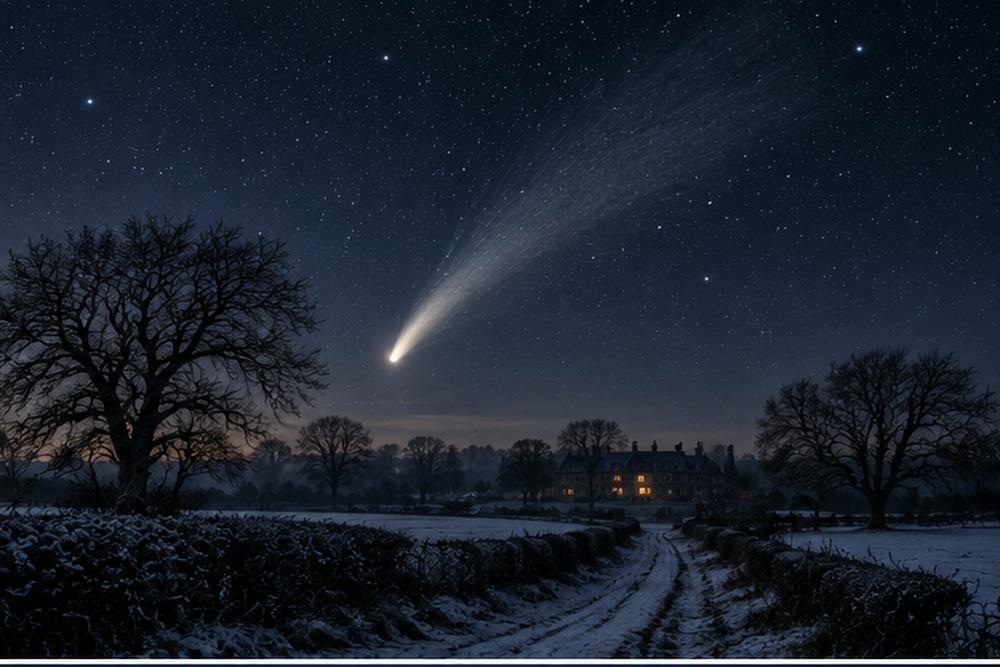
Figure F03-02. The return of Halley’s comet. An object that had terrified people for millennia arrived on schedule, summoned by mathematics decades after the mathematician’s death.
The effect on public confidence was immense. A theory that could reach out seventy-six years and name the return of a comet was not a philosophical opinion. It was knowledge of a new kind.
How fast is light?
While Newton’s ideas were spreading, another quiet revolution was under way, and it concerned the messenger rather than the message.
Almost everyone had assumed that light arrives instantly. In 1676 the Danish astronomer Ole Rømer, working at the Paris Observatory, showed otherwise, using Galileo’s moons of Jupiter as a clock. Io, the innermost moon, slips into Jupiter’s shadow every forty-two and a half hours, as regular as a metronome. Yet Rømer found that when the Earth was on the far side of its orbit from Jupiter, the eclipses ran late, and when the Earth was closest, they ran early. The timing error followed the changing distance.
His conclusion was that light takes time to cross the gap. From the size of the delay he estimated that light needs about twenty-two minutes to cross the diameter of the Earth’s orbit. The modern figure is nearer sixteen and a half minutes, but the point was made, and it was the first measurement of a quantity that would come to dominate twentieth-century physics.
There was a bonus. In 1729 the English astronomer James Bradley, trying and failing to measure the parallax of a star, found instead that all stars trace out tiny yearly loops in the sky. The cause is that the Earth is moving: the telescope must be tilted very slightly forwards, in the same way that you tilt an umbrella when walking through falling rain. This effect, called aberration, was the first direct observational proof that the Earth really does travel around the Sun. Copernicus had waited nearly two centuries for it. Bradley’s measurements also gave a better value for the speed of light, within a few per cent of the modern 299,792 kilometres per second.
Measuring the solar system
Kepler’s third law gives the relative sizes of the planetary orbits, but not their actual size. It tells you that Jupiter is 5.2 times further from the Sun than we are, without telling you how far we are. To fix the scale, astronomers needed to measure one distance in kilometres, and the chosen method was the transit of Venus.
Twice or so a century, Venus passes directly between us and the Sun, and can be seen crossing the Sun’s face as a small black dot. Halley pointed out that observers at widely separated places on Earth would see the dot take a slightly different path across the Sun, and so record slightly different crossing times. From that difference the distance to Venus, and hence the whole scale of the solar system, could be worked out.
The transits of 1761 and 1769 produced the first great international scientific collaborations. Hundreds of observers were sent out from several countries to the ends of the Earth. It was for the 1769 transit that James Cook sailed to Tahiti in the Endeavour, before going on to chart New Zealand and eastern Australia.
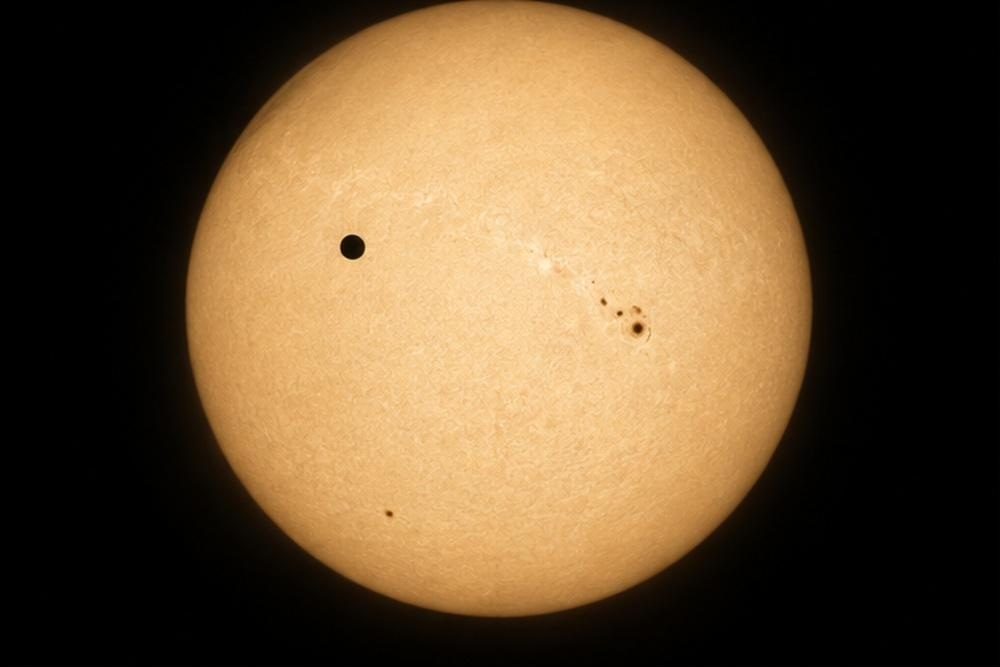
Figure F03-03. A transit of Venus. Timed from widely separated places on Earth, that small black dot gave humanity its first reliable measure of the distance to the Sun.
Not everyone was lucky. The French astronomer Guillaume Le Gentil set out for India in 1760, was prevented by war from landing in time, and watched the 1761 transit from the deck of a rolling ship, which made his measurements useless. Rather than go home, he waited eight years in the region for the next one, built an observatory, and on the morning of the transit in 1769 watched a single cloud cover the Sun for precisely the crucial hours. He returned to France after eleven years away to find that he had been declared dead and his estate divided among his relatives.
From the combined results, astronomers settled on a distance to the Sun of about 153 million kilometres. The modern value is 149.6 million. For the first time, the solar system had a true size, and it was enormous. Saturn, the furthest planet then known, lay nearly one and a half billion kilometres away.
Weighing the world
One thing Newton’s law could not give on its own was a weight. His equation says how the pull depends on the masses and the distance, but to turn that into kilograms you need to know how strong gravity actually is between two objects of known mass, and gravity between everyday objects is absurdly weak. Two people standing a metre apart attract each other with a force smaller than the weight of a grain of sand.
In 1798 the reclusive and immensely rich Henry Cavendish measured it anyway. He hung a light rod with a small lead ball at each end from a fine wire, forming a balance that would twist if the balls were pulled sideways even very slightly. Then he brought two large lead spheres close to them and watched, through a telescope from another room so that his own body heat would not disturb the apparatus, as the rod turned by a fraction of a degree. From the twist he could work out the force, and from the force, the strength of gravity itself.
That one number unlocked the rest. Knowing how hard the Earth pulls on a falling apple, and how strong gravity is in general, gives the mass of the Earth: about six thousand billion billion tonnes. Knowing the Earth’s orbit gives the mass of the Sun, some 330,000 times greater. This is how every mass in astronomy is found to this day. You never weigh a star or a galaxy directly; you watch how something moves under its pull and calculate what mass is needed to explain the motion. Keep that in mind, because in chapter 10 the same method will produce an answer that nobody wanted: most of the mass in the universe is invisible.
Herschel’s great telescopes
The next expansion of the universe came from a German musician living in the English spa town of Bath.
William Herschel was an oboist and composer who taught music by day and ground his own telescope mirrors by night, helped by his sister Caroline, who kept the household running, recorded his observations, and became a formidable astronomer in her own right, discovering eight comets.
On 13 March 1781, sweeping the sky with a home-made reflecting telescope, Herschel noticed an object that was not a point of light but a small disc. He first took it for a comet. Within months it was clear that it moved slowly along a nearly circular orbit far beyond Saturn. It was a new planet, the first discovered in recorded history, and it doubled the size of the known solar system at a stroke. Herschel proposed naming it after King George III, which went down poorly outside Britain; the name Uranus won out.
The discovery made him famous, and a royal pension let him give up music and build ever larger telescopes, culminating in 1789 in a monster with a mirror 1.2 metres across slung in a wooden frame twelve metres long.
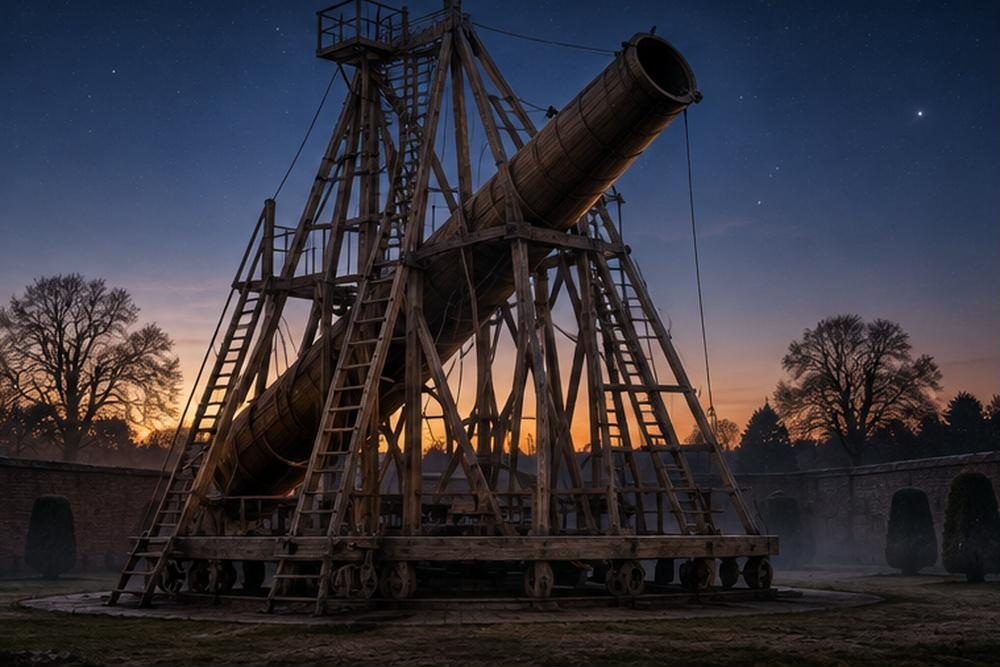
Figure F03-04. Herschel’s forty-foot telescope. Bigger mirrors gather more light, and more light reaches further into space; the whole history of observational astronomy follows this rule.
Herschel used his telescopes to ask a question nobody had been able to attack: what shape is the Milky Way? He counted the stars visible in hundreds of small sample patches of sky, on the assumption that stars are spread roughly evenly and that where he saw more of them, the system must extend further. His conclusion, published in 1785, was that the Milky Way is a flattened slab of stars, much wider than it is thick, with the Sun somewhere near the middle. The shape was right and the position was wrong, for reasons nobody could have guessed: dust in space hides most of the galaxy from view, so we seem to sit at the centre of our little visible bubble. It took until the twentieth century to correct, as we will see in chapter 5.
He also catalogued some two and a half thousand faint fuzzy patches, the nebulae, and speculated that at least some might be separate systems of stars, “island universes”, far outside our own. That question became the great argument of chapter 5.
In 1800 Herschel did one more thing that belongs to this book. Measuring the temperature of the different colours of sunlight split by a prism, he put a thermometer just beyond the red end, where there was no visible light at all, expecting a control reading. It showed the highest temperature of all. He had discovered infrared radiation: light we cannot see. Two centuries later, telescopes built to see in the infrared would find the most distant galaxies in the universe.
The first stellar distance
For all this, the single most important number in astronomy was still missing. Nobody knew how far away a single star was.
The obvious method was the one Aristarchus’s critics had demanded and Copernicus’s had repeated: parallax. As the Earth swings from one side of its orbit to the other, a nearby star should appear to shift slightly against the more distant background. Measure the shift, and simple geometry gives the distance.
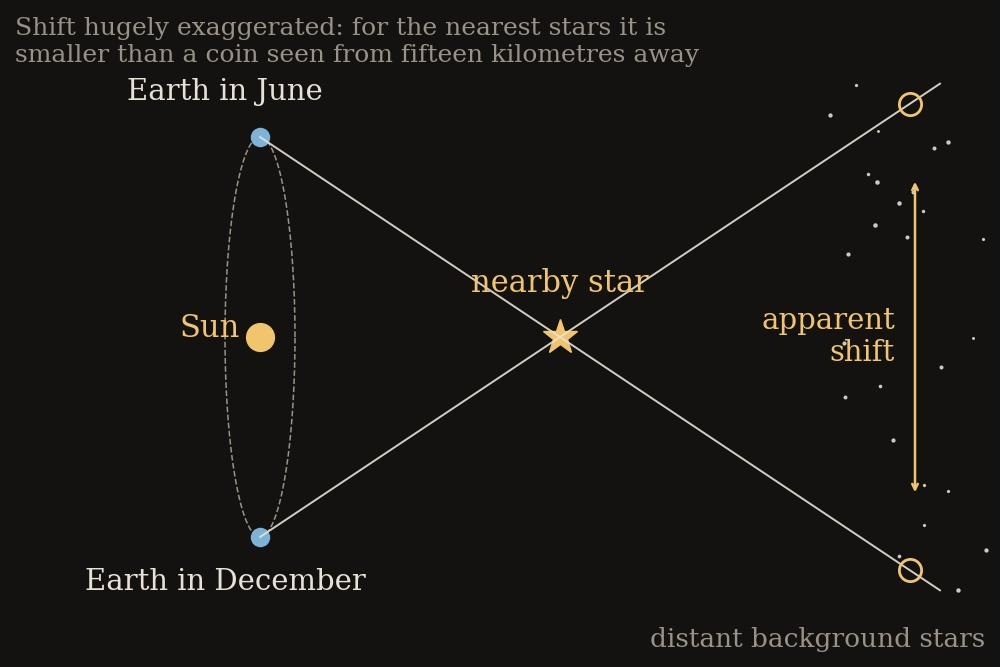
Figure F03-05. Parallax. Seen from opposite sides of the Earth’s orbit, a nearby star shifts against the distant background. The smaller the shift, the greater the distance.
The trouble was that the shift is minute. Astronomers had been hunting it since Tycho, and every claimed detection had evaporated. Bradley’s aberration, found in 1729, was a hundred times bigger than the parallax he was looking for.
Success finally came in 1838. Friedrich Bessel, at Königsberg, chose a modest star called 61 Cygni, not because it was bright but because it moves across the sky faster than almost any other, which suggested it was close. Using a fine new instrument, he measured its yearly wobble as about a third of a second of arc. That is the angle a one-euro coin would make if you looked at it from about fifteen kilometres away.
The distance that came out was about ten light-years, roughly a hundred trillion kilometres. Within months, Thomas Henderson announced a distance for Alpha Centauri, and Friedrich Struve one for Vega. The scale of the universe had jumped again, by a factor of hundreds of thousands. The stars were suns, and they were unthinkably far away.
KEY CONCEPT — Light-years, parsecs, and powers of ten
Kilometres become useless at these distances, so astronomers use two other units. A light-year is how far light travels in a year, about 9.5 trillion kilometres. Because light takes time to reach us, looking far away is also looking back in time: the nearest star system, Alpha Centauri, is 4.2 light-years away, so we see it as it was 4.2 years ago. A parsec, the professional’s unit, is the distance at which a star’s parallax wobble is one second of arc, and equals about 3.26 light-years.
Numbers this large are easier written as powers of ten. 10³ means 1 followed by three zeros, a thousand. 10⁶ is a million; 10⁹ a billion; 10¹² a trillion. Each step up the little number adds a zero, so 10²⁶ is 1 followed by 26 zeros. The system also runs the other way: 10⁻⁶ is a millionth. This is the only piece of mathematical shorthand used throughout this book, and it saves a great deal of counting: the observable universe is about 10²⁶ metres across, and an atom is about 10⁻¹⁰ metres, which tells you at a glance that the two differ by 36 steps of ten.
Meanwhile, Newton’s law kept passing tests. The most dramatic came in 1846. Uranus was not quite following its predicted path, and two mathematicians, Urbain Le Verrier in France and John Couch Adams in England, independently calculated that an unseen planet further out must be tugging at it. Le Verrier sent his prediction to the Berlin Observatory, where Johann Galle looked that same night, 23 September 1846, and found Neptune within a degree of the predicted spot. A planet had been discovered with pen and paper before anyone saw it.
Where things stood in 1850
By the middle of the nineteenth century the universe looked like a vast, orderly machine, and humanity had the manual.
One law of gravity governed everything from an apple to a comet. The solar system had been measured: a Sun 150 million kilometres away, planets out to Neptune, comets on long ellipses, all obeying the same equations. The first stellar distances had been measured and were staggering. The Milky Way had been shown to be a great flattened system of stars, and the possibility that the faint nebulae were other such systems was in the air. Light had a finite speed, so the sky was a record of the past. And there were even invisible kinds of light.
Two things were still entirely unknown, and they are the subjects of the next two chapters. Nobody knew what the stars are made of or what makes them shine, and nobody had any way of measuring the distance to anything further away than the nearest few stars. Both problems would be solved by the same unlikely tool: a prism, splitting starlight into a rainbow of colours with a barcode of missing lines.
There was also one tiny flaw in the machine. The point of Mercury’s closest approach to the Sun creeps around by a small amount each century, about the width of a human hair seen at arm’s length, and Newton’s law could not quite account for it. Le Verrier, fresh from Neptune, proposed another unseen planet, closer to the Sun, and it was even given a name, Vulcan. It was never found, because the explanation was not a missing planet. It was a missing theory of gravity.
Chapter 4 — Messages in Starlight
“We shall never be able by any means to study their chemical composition.” — Auguste Comte, on the stars, 1835
A rainbow with gaps
In 1835 the French philosopher Auguste Comte wanted an example of something that human beings could never possibly know. He chose the stars. We can measure their positions, their motions and their distances, he wrote, but their chemical composition is forever beyond us. It was a reasonable thing to say. You cannot bring a piece of a star into a laboratory.
He was wrong within his own lifetime, and the tool that proved him wrong was the most familiar object in physics: a glass prism.
Newton had shown in 1666 that a prism splits white light into a band of colours, and that the colours cannot be split further. Sunlight is a mixture. For well over a century that was where the matter rested, because nobody looked closely enough. The trick was to let the sunlight in through a narrow slit before it reached the prism, so that the spectrum spread out cleanly instead of smearing.
In 1802 the English chemist William Hyde Wollaston did just that, and noticed a few dark lines crossing the coloured band, like gaps in a fence. He assumed they were simply the natural boundaries between colours and thought no more about it.
Twelve years later a young Bavarian named Joseph Fraunhofer looked again. Fraunhofer had been orphaned at eleven and apprenticed to a glassmaker; at fourteen he was buried when the workshop collapsed, and survived. He became the finest optical craftsman in Europe, making lenses of unmatched purity, and he was examining sunlight only to test his glass. What he saw astonished him. The solar spectrum was crossed not by a handful of dark lines but by hundreds: sharp, narrow, and in fixed positions. He mapped 574 of them and labelled the strongest with letters, A through K, which astronomers still use today. He then turned his instrument on Venus, on Sirius and on other bright stars, and found that they too had dark lines, in patterns that differed from the Sun’s.
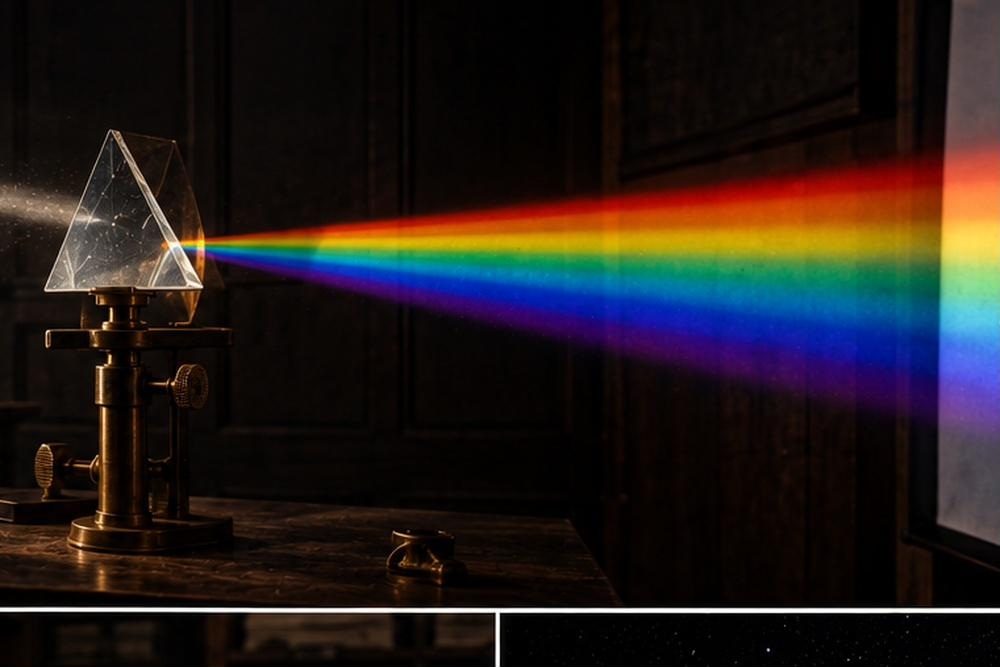
Figure F04-01. Splitting starlight. Fraunhofer’s improvement was to pass the light through a narrow slit first, which revealed hundreds of sharp dark lines hidden in the spectrum.
Nobody knew what the lines meant. They sat there for forty-five years, the most conspicuous unexplained fact in physics: a barcode printed on sunlight.
Fingerprints of the elements
The answer came in Heidelberg around 1859, from a partnership between the physicist Gustav Kirchhoff and the chemist Robert Bunsen, whose famous burner was designed to give an almost colourless flame so that it would not spoil the colours of whatever was put into it.
Chemists already knew that different substances burn with different colours. Sprinkle common salt into a flame and it glows yellow; copper gives green, potassium violet. Bunsen and Kirchhoff built an instrument that spread these flame colours out with a prism, and found that each element produces its own set of bright, sharp lines, at wavelengths that never vary. Sodium always gives the same close pair of yellow lines. Nothing else does. It is a fingerprint.
Kirchhoff then noticed something that made his skin prickle. The bright yellow pair from sodium sat at exactly the position of a pair of dark lines in the Sun’s spectrum, the ones Fraunhofer had labelled D. Testing further, he worked out the rule that explains everything.
KEY CONCEPT — Why spectra have lines
A hot, dense object such as a filament, a glowing coal or the deep interior of a star gives out light of every colour, a smooth continuous rainbow.
A thin, hot gas does the opposite. It gives out light only at a few precise wavelengths, appearing as a set of bright lines with darkness between them.
Now put that thin gas in front of the hot object. The gas absorbs exactly those same wavelengths out of the light passing through it, and scatters them off in all directions, so an observer beyond sees a continuous rainbow with narrow dark gaps: dark lines where the bright ones would have been.
That is precisely a star. A hot dense interior radiates all colours; a cooler, thinner atmosphere above it absorbs certain wavelengths on the way out. Read the missing wavelengths and you know which elements are in that atmosphere. Why an atom is so fussy about which colours it will absorb was itself a mystery until the 1910s, when it turned out to reveal the structure of the atom. That story is told in the companion volume; here, all that matters is that the pattern is unique and unchanging, and that it works whether the atoms are in a laboratory in Heidelberg or in a star ten thousand light-years away.
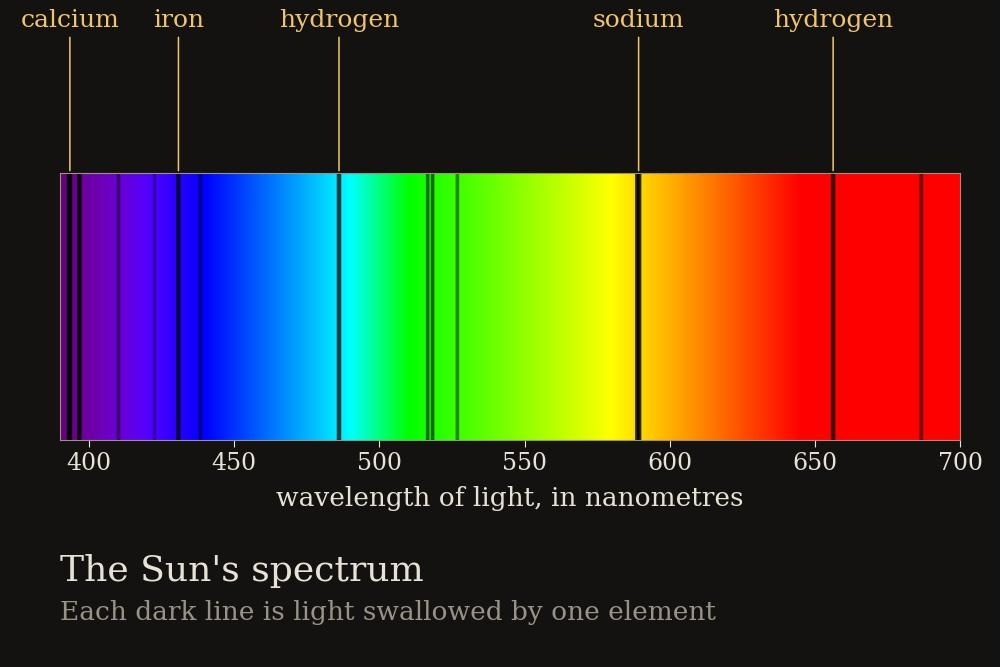
Figure F04-02. The Sun’s barcode. Each dark line marks light swallowed by a particular element in the Sun’s atmosphere, so the pattern says what the Sun is made of.
Comte’s impossible question had been answered five years after his death. The Sun contains sodium, iron, calcium, magnesium, hydrogen and much else, all identified by matching lines to samples burned in a German laboratory. Better still, the same technique worked on the stars. Their lines are the same lines, in different proportions and strengths.
KEY CONCEPT — The assumption behind all of cosmology
Reading a star’s composition from its lines only works if a sodium atom in a star behaves exactly like a sodium atom in Heidelberg. Every measurement in this book rests on the same assumption, usually called the universality of physical law: that the rules are the same in every place and at every time.
It is an assumption, but not a blind one. It is tested constantly, and it could fail at any moment. If the fine details of atomic physics were even slightly different in distant galaxies, the pattern of lines would be subtly out of step, and astronomers have looked hard for exactly that, so far without finding it. Light from quasars whose light set out more than ten billion years ago shows the same line patterns, in the same proportions, as a laboratory on Earth. So far as anyone can measure, the universe runs on one set of rules, unchanged since long before the Earth existed. Without that, there could be no science of the universe at all, only a catalogue of local curiosities.
Spectroscopy immediately started finding things. Bunsen and Kirchhoff discovered two new elements, caesium and rubidium, by spotting lines that matched nothing known. Then, during a total eclipse of the Sun in 1868, astronomers saw a yellow line in the Sun’s outer atmosphere that belonged to no element on Earth. Rather than assume a mistake, Norman Lockyer proposed a new element and named it after the Greek word for the Sun: helium. It was not found on Earth for another twenty-seven years. An element had been discovered 150 million kilometres away before anyone held it in a jar.
In England, a wealthy amateur named William Huggins converted his private observatory to spectroscopy and, from 1864, began answering questions that had seemed hopeless. Were the faint nebulae clouds of gas, or distant crowds of stars too far off to separate? Huggins looked at a nebula in Draco and saw not a continuous rainbow with dark lines, but a few isolated bright lines: the signature of a thin hot gas. Some nebulae, at least, were glowing clouds. Yet when he turned to the great nebula in Andromeda, he found a continuous spectrum with dark lines, exactly like starlight. Nobody could say why, and the question would not be settled for sixty years.
Huggins’ work after 1875 was done in partnership with his wife, Margaret Lindsay Huggins, born in Dublin in 1848, who had taught herself spectroscopy as a girl from a magazine article and built her own spectroscope. She was an equal partner in the observatory, pioneered the photography of spectra, and co-authored their great atlas of stellar spectra. Their Irish contemporary Agnes Clerke, from Skibbereen in County Cork, became the finest chronicler of this new science; her Popular History of Astronomy during the Nineteenth Century was read by professionals and general readers alike, and she was one of the few women of the time elected an honorary member of the Royal Astronomical Society.
The approaching and the receding
A spectral line is not only a label. Because its natural wavelength is known exactly, it is also a speedometer.
Everyone has heard the effect in sound. An ambulance coming towards you has a high-pitched siren; the moment it passes, the pitch drops. The siren has not changed. What changes is the spacing of the sound waves reaching you: squashed together as the source approaches, stretched apart as it recedes. Christian Doppler described this in 1842, and a few years later Hippolyte Fizeau pointed out that light must behave the same way. Approaching light is squashed towards the blue end of the spectrum; receding light is stretched towards the red.
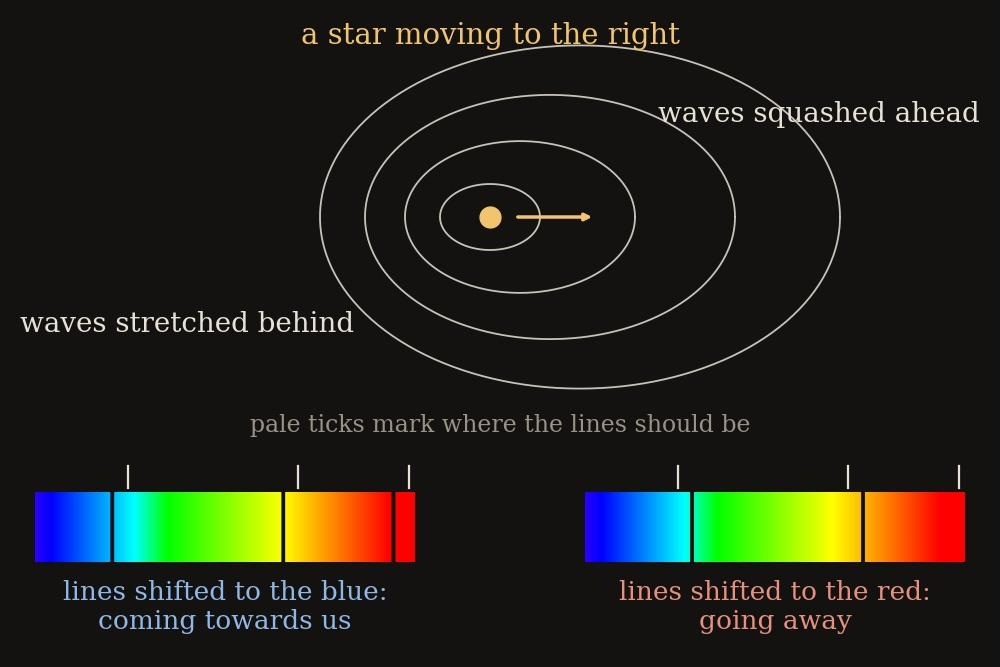
Figure F04-03. The Doppler effect. Motion towards us squashes the waves and shifts the lines towards blue; motion away stretches them towards red. The size of the shift gives the speed.
For a star, the shift is far too small to change its apparent colour. But the lines give it away. If the whole pattern of a star’s lines sits slightly to the red of where the laboratory says it should be, the star is moving away, and the size of the displacement says how fast. Huggins measured this for Sirius in 1868 and found it receding at a few tens of kilometres per second. For the first time, astronomers could measure motion directly towards or away from us, not merely across the sky.
The method paid off immediately in an unexpected way. Some stars turned out to have lines that shifted back and forth in a regular rhythm, red for a while, then blue, then red again. These were double stars, two suns circling one another so closely that no telescope could show them apart, betrayed only by the tell-tale swing of their spectra as first one and then the other swung towards us. Such pairs are common: roughly half of all stars have a companion. They are also precious, because a pair in orbit obeys Newton’s laws, and watching how fast and how widely the partners swing gives the masses of the stars themselves. Almost everything we know about how much stars weigh comes from double stars, and the same reasoning, applied to stars whipping around an invisible companion, will produce the first strong evidence for black holes in chapter 17.
THE EQUATION — Redshift
Take a known spectral line. Measure how much its wavelength has been stretched, and divide that by the wavelength it should have had. The answer is a pure number, with no units, called the redshift, written z.
In symbols: z = (observed wavelength − laboratory wavelength) ÷ laboratory wavelength.
For speeds that are small compared with light, the speed of recession is simply z multiplied by the speed of light. An example: a hydrogen line whose true wavelength is 656.3 nanometres is measured at 657.0. The stretch is 0.7, so z is 0.7 ÷ 656.3, or about 0.0011. Multiply by the speed of light, 300,000 kilometres per second, and the star is receding at about 320 kilometres per second.
Hold on to this small number. In chapter 6 it becomes the single most important measurement in cosmology, and at very large redshifts it stops meaning speed at all and starts meaning something stranger: how much the universe itself has stretched while the light was travelling.
The Harvard computers
By the 1880s, photography had reached astronomy, and it changed the science completely. A photographic plate can stare at the sky for an hour and accumulate light, seeing far fainter objects than the eye. It also keeps a permanent, measurable record that other people can check years later.
At Harvard College Observatory, the director Edward Pickering set out to photograph and classify the spectra of every star he could reach, using a prism placed over the telescope’s aperture so that each star on the plate appeared as its own tiny spectrum. Plates piled up by the tens of thousands. Someone had to examine them.
Pickering hired women. The reasons were partly practical and thoroughly ungenerous: women could be paid about half what men earned, and the work was considered clerical. They were called “computers”, which then meant a person who computes. They were not allowed to operate the large telescopes. Several of them turned out to be among the finest astronomers of their generation.
The scale of the enterprise is worth pausing on, because it is where astronomy turns from a craft into an industry. Over some sixty years Harvard accumulated about half a million glass plates, a photographic record of the whole sky repeated again and again. Each had to be examined by eye through a magnifying glass, star by star, and the results written into ledgers. The catalogue that came out of it, named after Henry Draper, whose widow funded the work, eventually listed a quarter of a million stars. Those plates still exist, in a climate-controlled basement in Cambridge, Massachusetts, and they are being digitised, because they are the only record of what the sky was doing before living memory: if an astronomer today wants to know whether a newly discovered flickering star was also flickering in 1890, the answer is in a wooden drawer.
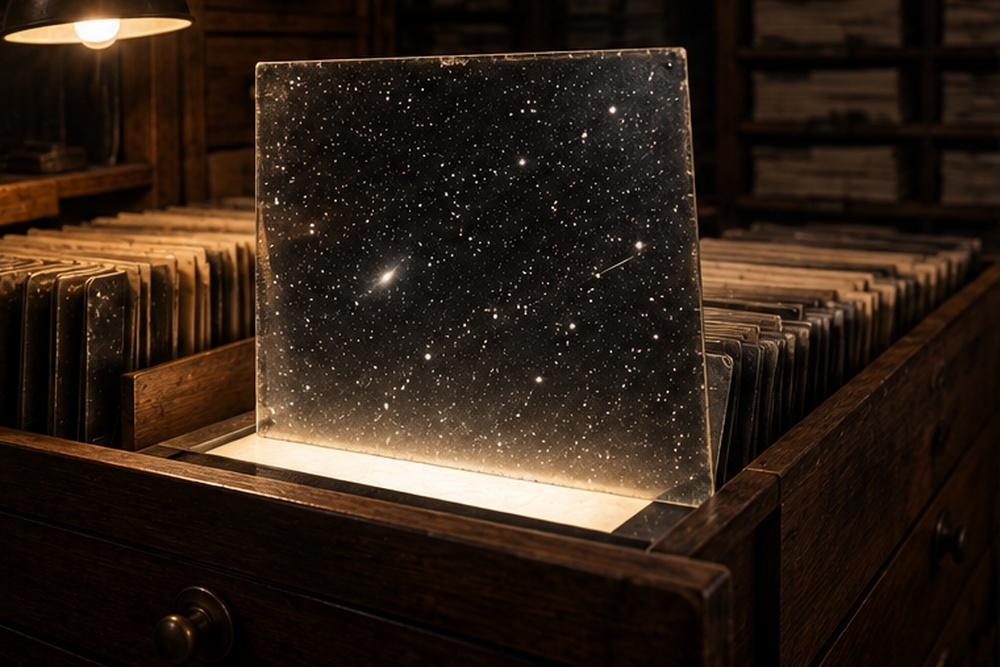
Figure F04-04. The Harvard plate archive. Half a million glass plates, each a permanent record of a piece of sky, examined by hand with a magnifying glass.
Williamina Fleming, a Scottish woman who had arrived in America pregnant and abandoned by her husband and had worked as Pickering’s housekeeper, classified some ten thousand stars, discovered dozens of variable stars and found the Horsehead Nebula. Antonia Maury devised a subtle classification scheme that later proved to contain crucial information about the size of stars.
Annie Jump Cannon, who was almost completely deaf from childhood, became the fastest and most accurate classifier of all, working through hundreds of thousands of spectra in her career, at times at a rate of three stars a minute. More importantly, she sorted out the muddle of competing schemes. Earlier classifications had lettered stars A, B, C and so on by the strength of their hydrogen lines. Cannon rearranged and merged them into a sequence that ran O, B, A, F, G, K, M, and found that it flowed smoothly, with no gaps, from bluish-white stars at one end to deep red at the other. Generations of students have remembered the order with the mnemonic “Oh Be A Fine Girl, Kiss Me”.
What nobody yet knew was what the sequence meant. It turned out to be a temperature scale: O stars are the hottest, at tens of thousands of degrees, M stars the coolest. That realisation would make sense of the lives of stars, in chapter 15.
Leavitt’s law
The most consequential discovery of all came from another of Pickering’s computers, and it solved a problem that had defeated astronomy since the Greeks: how to measure distance beyond the reach of parallax.
Henrietta Swan Leavitt, a clergyman’s daughter from Massachusetts who had also lost most of her hearing, was given the job of finding variable stars, those that change in brightness, by comparing photographs of the same patch of sky taken on different nights. She was exceptionally good at it, discovering more than two thousand.
Her attention settled on a particular kind of variable star called a Cepheid, named after the star Delta Cephei. A Cepheid does not flicker randomly. It swells and shrinks, brightening and fading in a smooth, utterly regular cycle lasting anything from a day or two to a couple of months, as reliable as a heartbeat.
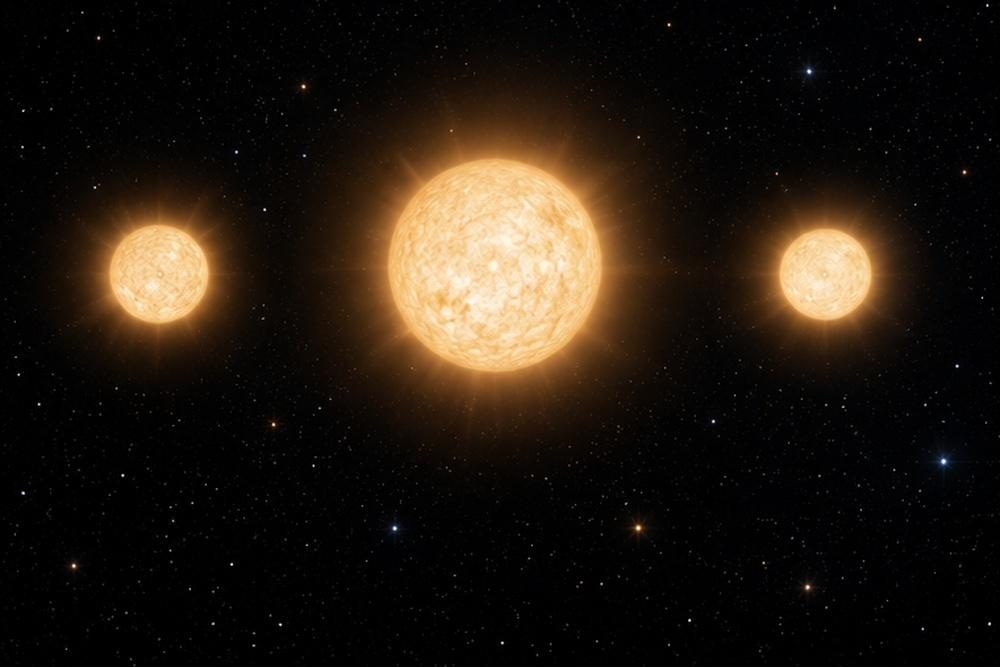
Figure F04-05. A Cepheid variable. These stars swell and shrink in a steady cycle, and the length of that cycle turns out to reveal how much light the star is really producing.
Leavitt was studying Cepheids in the Small Magellanic Cloud, a hazy patch visible from the southern hemisphere. Nobody knew how far away it was, but it was obviously a single group of stars, all at roughly the same distance from us, like people standing together in a distant field. That was the key.
Why any star should behave like this was not explained until the 1920s and 1930s, and the answer is a neat piece of physics. A Cepheid is an ageing star with a layer of helium below its surface. When that layer is compressed, the helium becomes more opaque, so heat coming from below is trapped rather than passing through. The trapped heat raises the pressure, the star puffs outwards, the layer thins and becomes transparent again, the heat escapes, and the star sags back under gravity. Then the cycle repeats. It is a valve, or a lid rattling on a pot, and like any oscillation its rhythm depends on the size of the thing oscillating. A big, luminous star takes longer to complete the cycle than a small one. That is why the pulse rate reveals the brightness.
She noticed, and in 1908 reported cautiously, that the brighter Cepheids in the cloud took longer to complete their cycle. In 1912 she published the full result with twenty-five stars: plot the length of the cycle against the brightness and the points fall on a straight line, with remarkably little scatter. Because all the stars were at essentially the same distance, differences in how bright they appeared had to be real differences in how much light they produced. Time the pulse, and you know the star’s true output.
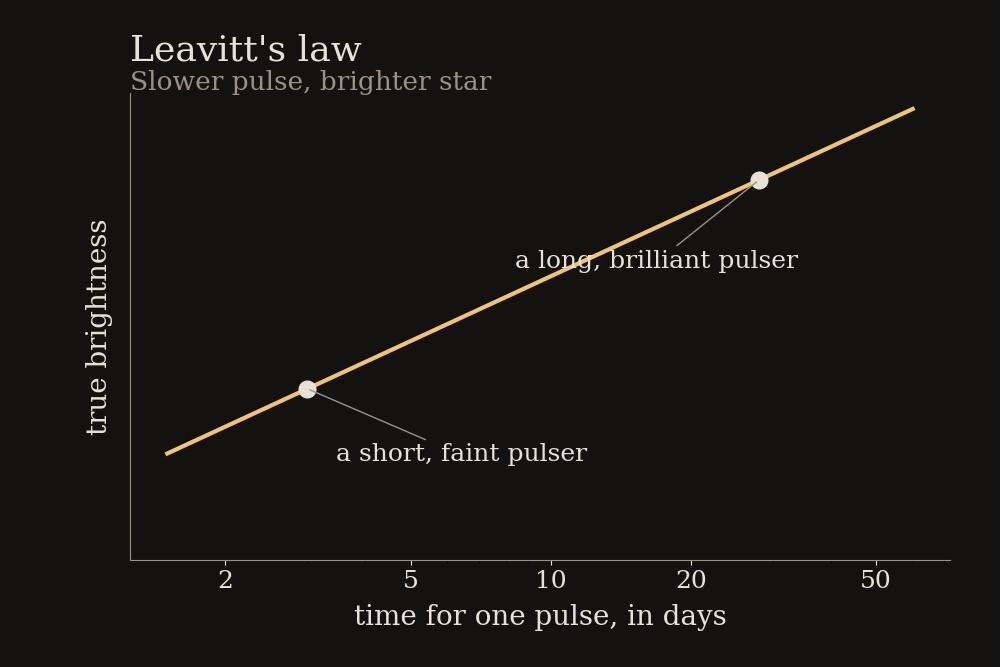
Figure F04-06. Leavitt’s law. The longer a Cepheid takes to pulse, the more light it truly gives out. Once the relation is calibrated, timing the pulse reveals the star’s real brightness.
To see why this matters, recall the inverse-square law from chapter 3. A lamp twice as far away looks a quarter as bright, one ten times further away a hundredth as bright. So if you know how bright something really is, and you measure how bright it looks, the ratio between the two gives you the distance. Astronomers call such an object a standard candle.
Leavitt had found the first good standard candle in history, and Cepheids are bright enough to be picked out in other galaxies. All that was missing was a calibration: the true brightness of one Cepheid at a known distance, to anchor the scale. Ejnar Hertzsprung supplied a first attempt in 1913 using statistical methods on nearby Cepheids, and the ladder was built.
Leavitt herself was moved on to other duties and did not get to develop her discovery. She died of cancer in 1921, aged fifty-three. Four years later a Swedish mathematician wrote to Harvard intending to nominate her for the Nobel Prize, and learned that she had been dead for years; the prize is not awarded posthumously. Within a decade her law would be used to prove that the universe is far larger than the Milky Way, and then to show that it is expanding. It is hard to name a more important measurement made by anyone in the twentieth century.
What the stars are made of
One question remained. Spectra could say which elements were present in a star. They could not easily say how much of each, because the strength of a line depends not only on how much of the element is there but also on the temperature, which decides how many of its atoms are in a state that can absorb light at all.
The answer came from Cecilia Payne, a young English woman who had studied at Cambridge, where she attended a lecture by Arthur Eddington on the 1919 eclipse expedition (chapter 6) and was captivated. Cambridge would not grant degrees to women at the time, so she took a fellowship to Harvard, and in 1925 submitted a doctoral thesis on stellar atmospheres.
Using new physics on how atoms behave at different temperatures, she showed that the great variety of stellar spectra, Annie Cannon’s whole sequence from O to M, comes almost entirely from differences in temperature rather than differences in composition. Nearly all stars are made of much the same stuff. And when she worked out the proportions, she found that stars are overwhelmingly hydrogen, with helium next, and everything else a trace: less than one atom in a thousand.
This was not what anyone expected. The prevailing view was that the Sun had much the same composition as the Earth. The eminent astronomer Henry Norris Russell, reviewing her thesis, told her the hydrogen result was clearly impossible, and she toned it down in the published version, calling it spurious. Four years later Russell reached the same conclusion by a different route and published it himself, with a brief acknowledgement of her earlier work. His name was attached to the discovery for decades. Her thesis is now routinely described as the most brilliant ever written in astronomy.
Payne was right, and the consequences run through the rest of this book. The universe is mostly hydrogen, the simplest element of all, with about a quarter of its ordinary matter as helium and almost nothing else. Any theory of how the universe began has to explain that particular recipe. In chapter 8 we will see that it is one of the strongest pieces of evidence for the Big Bang.
Where things stood in 1925
In ninety years, the impossible question had become routine. Starlight could be split, its lines read, and the elements in a star named and measured. The same lines, shifted a fraction, gave the star’s speed towards or away from us. Photographic plates recorded hundreds of thousands of spectra for patient analysis. A pulsing star could be timed to reveal its true brightness, and so its distance, far beyond the reach of parallax.
The tools were now in place, and every one of them would be needed at once, because two questions were coming to a head. The faint spiral nebulae: were they clouds within our galaxy, or separate galaxies far beyond it? And why did their spectral lines, as one American astronomer had begun to notice, seem so persistently shifted towards the red?
Chapter 5 — Island Universes
“The history of astronomy is a history of receding horizons.” — Edwin Hubble, 1936
Smudges in the dark
Sweep a small telescope across a clear night sky and, among the sharp points of the stars, you will come across things that refuse to sharpen. They stay soft and smudged however carefully you focus: faint patches of light, some round, some ragged, some elongated. Astronomers called them nebulae, from the Latin for cloud, and for two centuries nobody knew what they were.
The first systematic list came from a man who regarded them as a nuisance. Charles Messier was a French comet hunter, and a comet in a small telescope looks exactly like a faint fuzzy patch. To stop himself being fooled by the same patches over and over, he compiled a catalogue of things that looked like comets but were not. His list of about a hundred objects, published in the 1770s and 1780s, is still in use: the objects in it carry an M and a number, and include some of the most beautiful sights in the sky. Messier’s rejects turned out to be far more interesting than the comets he was chasing.
William Herschel, with his far larger telescopes, went on to catalogue some two and a half thousand of these objects. And as their numbers grew, so did the argument about what they were.
Two rival ideas were on the table, and both were reasonable.
The first came from the philosopher Immanuel Kant, who in 1755, building on an idea by the Englishman Thomas Wright, suggested that the Milky Way is a flattened disc of stars seen from inside, and that some of the faint elliptical patches might be other such discs, unimaginably far away. Kant called them island universes: separate systems of stars floating in an immense ocean of empty space.
The second idea came later and had powerful support. Pierre-Simon Laplace proposed that the solar system had formed out of a spinning cloud of gas that flattened and condensed. If so, the nebulae might be exactly that: clouds of gas within our own Milky Way, caught in the act of making new solar systems. On this view the nebulae were not distant galaxies but nearby nurseries, and the Milky Way was the whole universe.
Deciding between the two needed two things that nobody had: a way to see the structure of a nebula, and a way to measure how far away one was. The first arrived in Ireland.
The Leviathan of Parsonstown
William Parsons, the third Earl of Rosse, was a wealthy Anglo-Irish landowner and, unusually for his class and time, an obsessive engineer. His home was Birr Castle in County Offaly, in the flat middle of Ireland, a place with reliably poor weather and no scientific community for a hundred kilometres. He decided to build there the largest telescope in the world.
The hard part was the mirror. Glass mirrors coated with silver did not yet exist; mirrors were cast from speculum metal, a brittle alloy of copper and tin that tarnishes and must be repolished. Rosse taught himself metallurgy and, after several failures and one mirror that cracked while cooling, cast a disc 1.8 metres across weighing nearly four tonnes. He built the grinding and polishing machinery himself, driven by a steam engine, and employed local workers who learned the trade from scratch.
The finished instrument, completed in 1845, had a tube some seventeen metres long slung between two masonry walls the size of a small church. It could swing up and down and only a little from side to side, so an object had to be caught during the hour or so that the turning Earth carried it past the gap between the walls. Everyone called it the Leviathan of Parsonstown, Parsonstown being the old name for Birr.
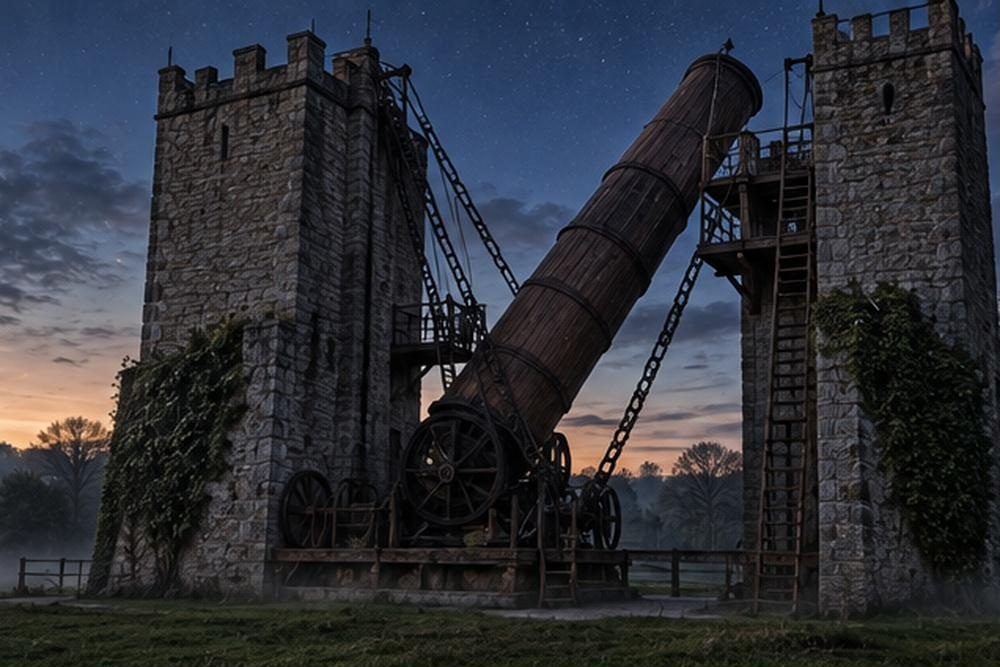
Figure F05-01. The Leviathan of Parsonstown. For over seventy years the largest telescope on Earth stood in the Irish midlands, and with it the structure of the nebulae was seen for the first time.
Its timing was grim. The telescope saw first light in February 1845, and that autumn the potato blight arrived. Through the years of the Great Famine, Rosse spent heavily on relief in the town and reportedly served on the local relief committee; the observing notebooks from those years are thin.
What it saw, though, changed the argument. In the spring of 1845 Rosse turned the great mirror on a nebula in Messier’s catalogue, number 51, and saw something no human being had seen before: a clear spiral, a whirlpool of light winding in from a bright centre, with a smaller blob attached at the end of one arm. His drawing of it is one of the most famous images in the history of astronomy.
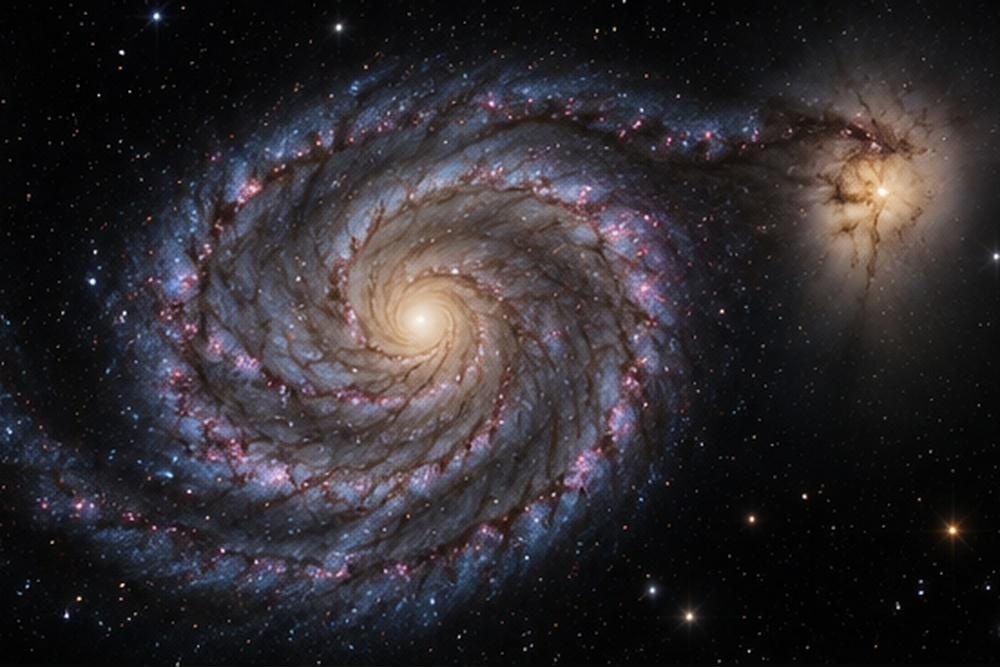
Figure F05-02. The Whirlpool, Messier 51. Rosse’s telescope revealed that some nebulae have spiral structure, which immediately raised the question of what could be spinning.
Over the following years the Leviathan found spiral structure in a dozen or more nebulae. Rosse also sketched a ragged nebula in Taurus whose shape suggested a crab, and the Crab Nebula has been called that ever since. A spiral implies rotation, and rotation implies a system, something organised and probably held together by its own gravity. It did not prove the nebulae were other galaxies, but it made them far harder to dismiss as shapeless clouds.
Birr trained people as well as mirrors. Among the assistants who worked at the telescope were the Stoney brothers from County Offaly: Bindon Blake Stoney, who went on to build much of modern Dublin’s port and bridges, and George Johnstone Stoney, who gave physics the word electron. The Danish astronomer J. L. E. Dreyer worked at Birr in the 1870s before becoming director of Armagh Observatory, where he compiled the New General Catalogue of nebulae and clusters, published in 1888. Its numbering is still the standard: when a modern astronomer refers to NGC 4594, they are using a catalogue assembled in County Armagh.
Observing with the Leviathan was not comfortable work. The observer stood on a wooden gallery high above the ground, in the damp Irish night, catching an object as it drifted past the slot of sky between the walls, and drew what he saw by the light of a shaded lamp. There was no photography for the first forty years of its life, so every result was a sketch made by a cold man in the dark, and sceptics were entitled to wonder how much of a spiral was in the nebula and how much in the eye. When photography finally arrived and could be applied to nebulae, from the 1880s onward, the spirals were still there. Rosse’s observers had been right.
The deadlock
Photography and spectroscopy sharpened the question without answering it.
The spectra were genuinely confusing. As we saw in chapter 4, Huggins had found in 1864 that some nebulae show the bright lines of a hot thin gas. Those objects, we now know, really are clouds of glowing gas inside our galaxy. But others, including the great spirals, showed a continuous spectrum crossed by dark lines: the signature of starlight, from many stars blended together. That pointed towards Kant’s island universes. Against this, the spirals cluster oddly in the sky, avoiding the band of the Milky Way entirely, which seemed to link them to our galaxy in some way. (The real reason is the dust, which hides everything beyond the disc in exactly that band; astronomers of the time called the empty strip the Zone of Avoidance.)
Then, in August 1885, a star appeared in the middle of the Andromeda nebula, rose to be almost visible to the naked eye, and faded away over a few months. If Andromeda were a distant galaxy of billions of stars, that single star would have to have been shining with the light of a hundred million Suns, which seemed frankly absurd. The natural conclusion was that Andromeda must be close, and so must be a small object inside our own system.
That single star, S Andromedae, was in fact the first supernova ever seen outside the Milky Way, an exploding star briefly outshining an entire galaxy, and it really was as absurdly bright as it seemed. Nobody could have known. Chapter 15 explains how such an explosion is possible. In the meantime it looked like strong evidence for the wrong answer, which is a useful thing to remember whenever a single striking observation seems to settle a question.
What are we inside?
Before anyone could judge whether the nebulae lay outside the Milky Way, they had to know how big the Milky Way was, and where we sit in it. Both questions turned out to be harder than they looked, for one simple reason: we are inside the thing we are trying to map, and the view is dirty.
Figure F05-03. The Milky Way from a dark site. We see our own galaxy edge-on from within, which is why working out its shape and our place in it took so long.
Herschel had counted stars and concluded that the Milky Way is a flattened slab with the Sun near the middle. A century later the Dutch astronomer Jacobus Kapteyn did the same job far more thoroughly, with photographs and statistics, and got the same answer: a disc some 40,000 light-years across with the Sun close to its centre. It was wrong, and the reason was dust.
Space between the stars is not empty. It contains thin clouds of gas and fine grains of dust, and although the dust is extraordinarily sparse, there is a great deal of space to pass through. Over thousands of light-years it dims and reddens starlight severely, and in the plane of the Milky Way it blocks the view almost completely. Herschel and Kapteyn were not seeing the edge of the galaxy. They were seeing the edge of the fog, which surrounds us equally in all directions and so puts us apparently at the centre of everything. Robert Trumpler proved this in 1930 by showing that distant star clusters look systematically dimmer and redder than they should.
The way around the fog had already been found, by looking out of the plane of the galaxy rather than through it. Harlow Shapley, a former crime reporter from Missouri who had come to astronomy almost by accident, studied the globular clusters: tight, roughly spherical swarms of hundreds of thousands of old stars, which lie mostly above and below the Milky Way’s disc where the dust is thin.
Shapley used the trick from chapter 4. The clusters contain pulsating variable stars, so he could time their pulses, read off their true brightness and calculate their distances. Then he plotted where they were in three dimensions, and found that they are not spread evenly around us. They form a great ball whose centre lies far away in the direction of the constellation Sagittarius.
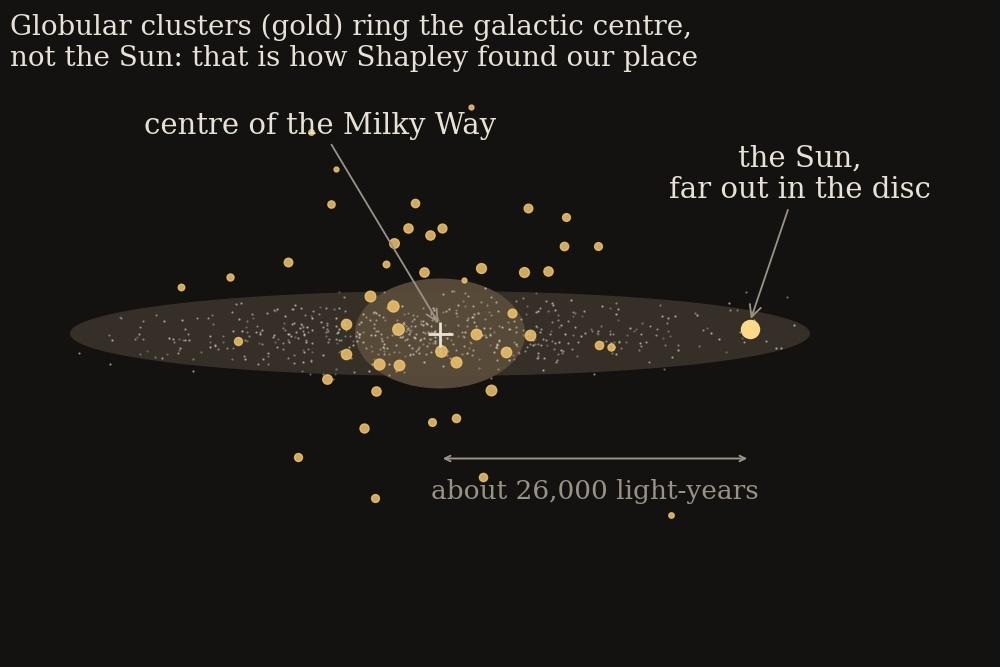
Figure F05-04. Shapley’s result. The globular clusters cluster around a point tens of thousands of light-years away, so the Sun sits far out in the suburbs, not at the centre.
The conclusion, published in 1918, was that the Sun is nowhere near the middle of the Milky Way. We are far out towards the edge of the disc, and the centre lies tens of thousands of light-years away behind the dust clouds of Sagittarius. Copernicus had moved the Earth out of the centre of the solar system; Shapley moved the Sun out of the centre of the galaxy.
He also concluded that the Milky Way is enormous, perhaps 300,000 light-years across, about three times the modern figure. His distances were too large because he had not allowed for dust, and because the pulsating stars he used came in two different varieties, a subtlety not untangled for another thirty years. And this overestimate led him, quite logically, to the wrong answer about the nebulae. If our own galaxy is that vast, then the faint spirals could comfortably be small objects inside it or just outside, and there was no need for island universes at all.
The Great Debate
On 26 April 1920, at the Smithsonian in Washington, Shapley and the Californian astronomer Heber Curtis gave back-to-back talks on “the scale of the universe”. It has been known ever since as the Great Debate, although it was less a debate than two lectures with a polite discussion afterwards.
Curtis argued that the Milky Way is modest in size, that the Sun sits near its centre, and that the spiral nebulae are separate galaxies far beyond it. His evidence was good. Novae, stars that suddenly flare up, had been spotted in several spirals, and they appeared so faint that the spirals had to be enormously distant. Photographs showed that many spirals have dark lanes of obscuring material along their length, exactly like the dust lanes of the Milky Way seen edge-on, suggesting they are systems of the same kind. Their spectra looked like the combined light of many stars, not like glowing gas.
Shapley argued that the Milky Way is gigantic and the Sun is far from the centre, and that the spirals are therefore comparatively local objects rather than rival galaxies. He too had evidence. Adriaan van Maanen, a well-respected colleague, claimed to have measured spiral nebulae actually rotating on photographs taken a few years apart. If a spiral were millions of light-years away, such a rotation would mean its outer parts were moving faster than light. Van Maanen’s measurements, it later turned out, were simply wrong, a case of a careful observer finding what he expected to find at the very limit of what his plates could show. But at the time they seemed decisive.
The debate settled nothing, because each man was right about half of it. Shapley was right about the Milky Way, Curtis about the nebulae. What was needed was not more argument but a distance, and that meant finding a recognisable standard candle inside a spiral. For that you needed a bigger telescope.
It is worth noticing how the disagreement was eventually resolved, because the pattern repeats throughout this book. Neither side changed its mind because of a clever argument. Both sides had arguments, and both had evidence, and some of the evidence on each side was quietly wrong. What ended the dispute was a new instrument that could measure something neither man had been able to measure at all.
“VAR!”
There was one, on Mount Wilson above Los Angeles. The Hooker telescope, with a glass mirror 2.5 metres across, had come into use in 1917 and was the largest in the world, the first to surpass Rosse’s Leviathan after seventy years.
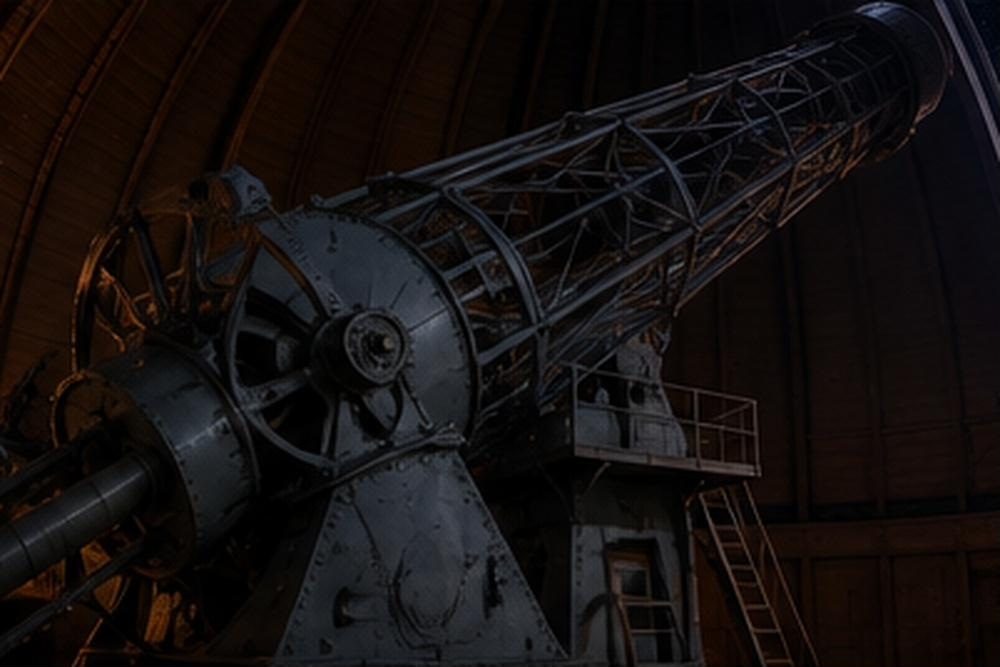
Figure F05-05. The 100-inch Hooker telescope on Mount Wilson. Its great glass mirror could pick out individual stars in the spiral nebulae, and that was the whole game.
The man who used it best was Edwin Hubble: an Oxford-educated lawyer turned astronomer, a competent amateur boxer, and by all accounts an insufferable self-promoter who affected an English accent for the rest of his life. He was also a superb observer with an unerring sense for the important problem.
Through 1923 Hubble photographed the Andromeda nebula, Messier 31, hunting for novae in its outskirts. On the night of 5 October he caught what he took to be another nova, and marked the plate with an N. Checking it against earlier plates of the same field, he realised that the star had brightened and faded before: it was not a nova at all, but a variable star, and one with the tell-tale rhythm of a Cepheid. He crossed out the N and wrote “VAR!” beside it. The plate survives, with the exclamation mark.
The rest was arithmetic of the kind chapter 4 set up. The star took about a month to complete each cycle. Leavitt’s law turns that into a true brightness. Compare that with how faint it looked, apply the inverse-square law, and out comes a distance: at the time, about 900,000 light-years. That was far beyond even Shapley’s oversized Milky Way. Andromeda was not in our galaxy. It was a galaxy.
Hubble, cautious and aware of van Maanen’s claims, sat on the result for a year while he found more Cepheids, and let it be announced at a meeting of American astronomers on New Year’s Day 1925. Shapley, reading an early letter about it, is said to have remarked to a colleague that it was the letter that destroyed his universe. To his credit, he accepted it.
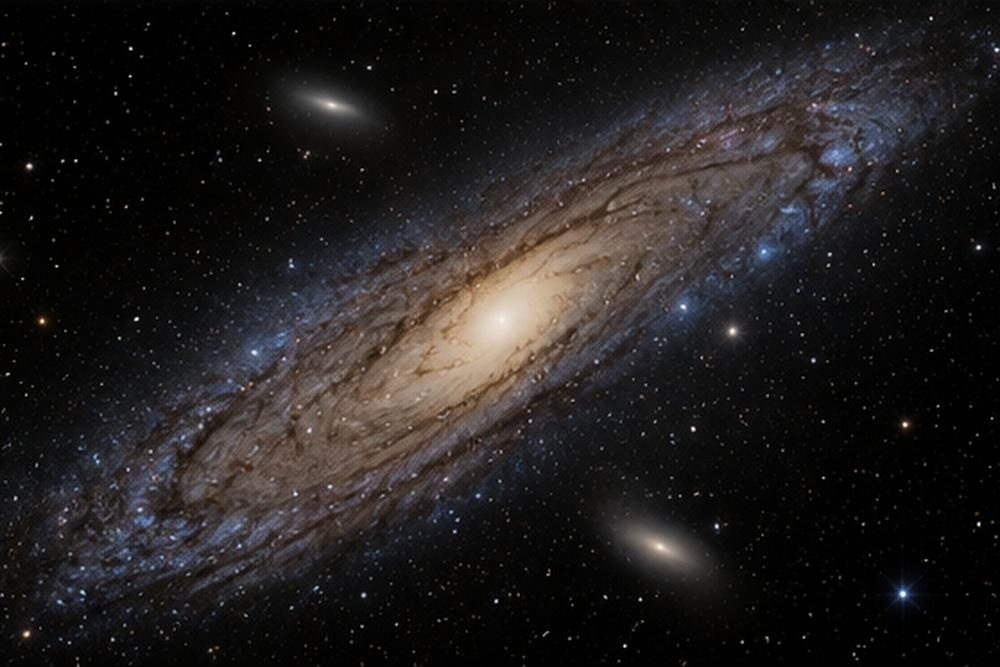
Figure F05-06. The Andromeda galaxy. Once a smudge in Messier’s list of nuisances, it is the nearest large galaxy to our own and the first object proved to lie beyond the Milky Way.
The modern distance to Andromeda is about 2.5 million light-years, nearly three times Hubble’s figure. His Cepheids were of the brighter of the two varieties that Shapley’s scale had also confused, an error corrected by Walter Baade in 1952, which at a stroke doubled the size of the known universe. But the conclusion was unaffected, and it is one of the largest single expansions of human horizons in history.
Hubble did not stop at Andromeda. Over the following years he found Cepheids in other spirals, measured distances to them, and began sorting galaxies by their appearance into the scheme still used today: ellipticals, ordinary spirals, barred spirals and the irregulars that fit nowhere. Chapter 18 takes up that classification and what it means. The immediate effect was linguistic as much as scientific. The old word nebula had covered everything faint and fuzzy, from a glowing cloud of gas a thousand light-years away to a galaxy of two hundred billion stars ten million light-years away. Now the two had to be separated, and the word galaxy, from the Greek for milk, was pressed into service for the second.
KEY CONCEPT — What a galaxy is
A galaxy is a gravitationally bound system of stars, gas, dust and dark matter, held together by its own gravity and separated from its neighbours by mostly empty space. Our own, the Milky Way, contains a few hundred billion stars in a disc about 100,000 light-years across, with a central bulge and a surrounding halo of globular clusters. The Sun lies roughly 26,000 light-years from the centre and takes about 230 million years to go round once: the last time the Sun was in its present position, dinosaurs had not yet appeared.
The scale is hard to hold in the mind, so try this. If the Milky Way were shrunk to the size of Ireland, the whole solar system out to Neptune would be about the size of a pea, and the nearest star to the Sun would be some twenty metres away. On that scale Andromeda would be a second Ireland-sized disc about eleven thousand kilometres off, further than Tokyo.
KEY CONCEPT — The first rungs of the distance ladder
No single method measures all cosmic distances. Instead astronomers build a ladder, where each rung is calibrated by the one below it.
The bottom rung is parallax, the direct geometry of chapter 3: measure a nearby star’s tiny yearly wobble and you have its distance with no assumptions at all. It works out to a few thousand light-years with modern space telescopes, and reached only a few tens of light-years in the 1920s.
The second rung is Cepheid variables. Find some within parallax range, use their measured distances to work out how bright they truly are, and Leavitt’s law is calibrated. Now any Cepheid anywhere, out to tens of millions of light-years, will tell you its distance if you can time its pulse.
Each rung reaches further and each depends on the accuracy of the one beneath, so an error low down propagates all the way up. That is exactly what happened with Hubble’s first distance to Andromeda, which was too small by a factor of nearly three. Chapter 13 returns to this ladder, because a disagreement about its higher rungs is one of the biggest unsolved problems in cosmology today.
Where things stood in 1925
In eighty years the universe had been turned inside out twice.
Rosse’s great mirror had shown that some nebulae are spirals. Shapley’s globular clusters had shown that the Sun is not at the centre of the Milky Way. And Hubble’s variable star had shown that the Milky Way is not the universe but one galaxy among many. The faint smudges in Messier’s catalogue of nuisances included whole star systems, millions of light-years away, each with its own hundreds of billions of stars. The universe had grown by a factor of a million in a century, and there was no sign of an edge.
Meanwhile, for more than a decade, another American astronomer had been quietly gathering a set of measurements that nobody could explain. Vesto Slipher, at the Lowell Observatory in Arizona, had been taking spectra of the spiral nebulae since 1912, using the Doppler method of chapter 4 to measure their speeds. What he found was strange. A few of them were approaching us. The overwhelming majority were rushing away, at hundreds and then thousands of kilometres per second, faster than anything previously measured in the sky.
Nobody knew why. And nobody could make anything of it until someone put Slipher’s speeds and Hubble’s distances on the same sheet of paper.
Chapter 6 — Stretching Space
“Spacetime tells matter how to move; matter tells spacetime how to curve.” — John Archibald Wheeler
Riding a beam of light
As a teenager, Albert Einstein asked himself what you would see if you could ride alongside a beam of light. A light wave that stood still beside you, presumably: a frozen ripple of electricity and magnetism, hanging motionless in space. The trouble is that the equations of electricity and magnetism, worked out by James Clerk Maxwell in the 1860s, do not allow such a thing. Light in those equations always moves, always at the same enormous speed.
In 1905, working as a clerk in the Swiss patent office in Bern, Einstein resolved the contradiction in the most radical way available. He took the awkward fact at face value: the speed of light is the same for everyone, no matter how fast they are moving. Then he followed the consequences.
They are strange. If you and I are moving relative to one another, we cannot agree on how long a second lasts, or how long a metre is, or whether two distant events happened at the same moment. A moving clock runs slow as seen by someone it passes. A moving object is shortened along its direction of travel. Neither effect is an illusion or a fault in the instruments; time and space themselves behave this way. We do not notice because the effects only become obvious at speeds approaching that of light, and nothing in daily life goes remotely that fast. But they are real and measured daily: the satellites of the global positioning system would give wrong positions within minutes if their clocks were not corrected for exactly these effects.
Out of the same reasoning came the most famous equation in science, E = mc², which says that mass and energy are two forms of the same thing, and that a very small amount of mass corresponds to an enormous amount of energy, since the conversion factor is the speed of light multiplied by itself. That equation will explain what makes stars shine, in chapter 15.
The deepest change, though, was to the stage on which everything happens. Space and time had always been the fixed backdrop of physics: an eternal grid, and a clock ticking the same everywhere. After 1905 they were joined into a single thing, spacetime, whose measurements depend on the observer. The backdrop had begun to move.
Gravity as a curve
Special relativity had a glaring gap: it said nothing about gravity. Worse, it appeared to contradict Newton, whose law required gravity to act instantly across any distance, while relativity forbids anything from travelling faster than light.
Einstein spent ten years on the problem. The key came from what he later called the happiest thought of his life. Imagine a man falling freely, for example in a lift whose cable has snapped. While he falls, he feels no weight at all. Everything in the lift falls with him; a dropped coin hangs beside his hand. Gravity has vanished from his world. Conversely, someone in a windowless spacecraft being accelerated steadily would feel pressed to the floor exactly as if gravity were pulling them.
If gravity and acceleration are indistinguishable, then gravity is not really a force at all, in the way that magnetism is a force. It is what you feel when something prevents you from falling freely. Right now, reading this, you feel your weight only because the chair is pushing you off the natural path you would otherwise follow.
And what is that natural path? Here is Einstein’s answer, published in 1915 as the general theory of relativity: mass and energy bend spacetime around them, and objects then travel as straight as they can through the bent geometry. The bending is what we call gravity.
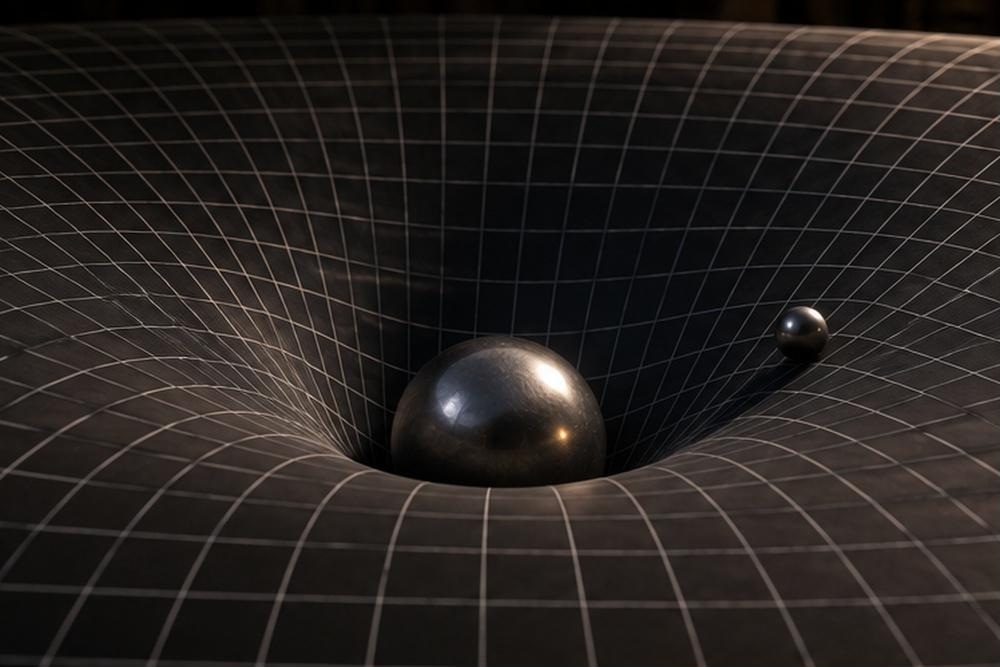
Figure F06-01. The standard picture of curved space. A mass dents the geometry around it, and other objects roll along the dent. The analogy is imperfect, but it captures the essential idea: gravity is shape, not pull.
The usual image is a heavy ball on a stretched rubber sheet, with smaller balls rolling around the dip it makes. It is a flawed analogy, not least because it uses gravity to explain gravity, and because it shows only two dimensions of space and none of time. But it carries the central idea. The Earth is not held by an invisible rope from the Sun. It is coasting freely through a region whose geometry the Sun has curved, and the straightest available path through that curved geometry happens to be an orbit.
The theory made three predictions that could be checked. The first concerned Mercury, whose orbit, as chapter 3 noted, drifts by a tiny amount each century that Newton could not explain. Einstein calculated the effect of the curved spacetime near the Sun and got the missing amount exactly. He said afterwards that the result gave him palpitations. The second was that clocks run slower deeper in a gravitational field, which has since been measured between the top and bottom of a laboratory bench. The third was that light itself must be deflected as it passes a massive object, since light too must follow the curved geometry, and Einstein calculated that a ray grazing the Sun should be bent by about 1.75 seconds of arc, twice what a rough Newtonian argument would give.
The third prediction was testable, if you could see stars whose light passed close to the Sun. That means waiting for a total eclipse.
The eclipse that made headlines
The eclipse of 29 May 1919 was well placed for the test, and it fell in a year when the Sun would be in front of a rich field of bright stars. The British astronomer Arthur Eddington, one of the few people outside Germany who had mastered the new theory, organised two expeditions: one to the island of Príncipe off West Africa, where he went himself, and one to Sobral in northern Brazil.
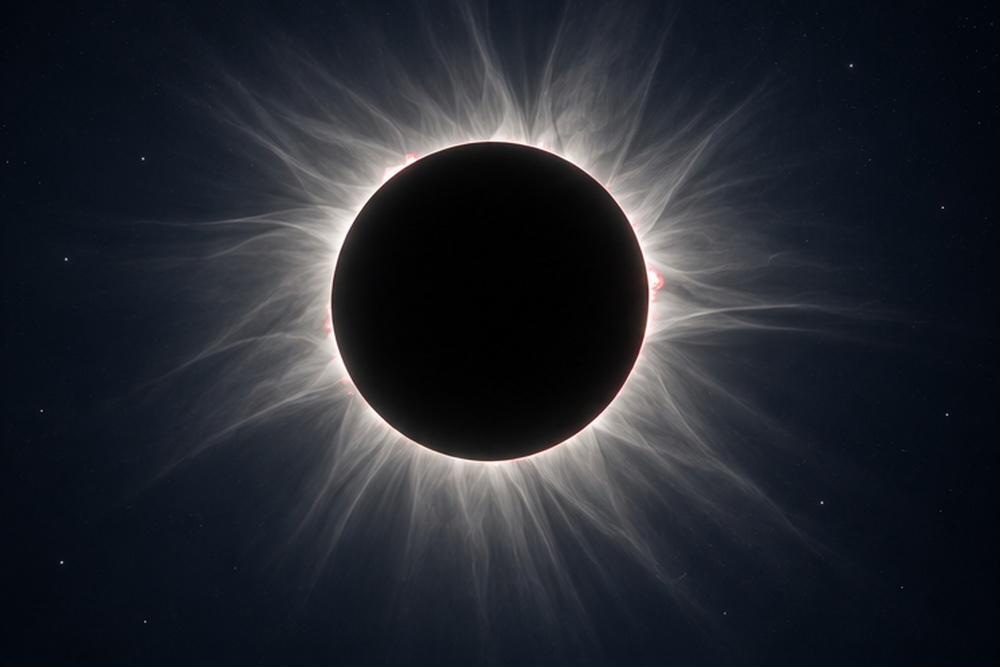
Figure F06-02. Totality. For a few minutes the Sun’s glare is blocked and stars can be photographed close to its edge, revealing whether their light has been bent on the way past.
The method was simple in principle. Photograph the star field around the eclipsed Sun. Photograph the same star field months later, at night, when the Sun is elsewhere. If the stars near the Sun’s edge appear very slightly shifted outwards in the eclipse photographs, their light has been bent.
The execution was miserable. It rained at Príncipe that morning and the clouds parted only near the end of totality; of sixteen plates, two were usable. The Sobral team had trouble with their main telescope’s focus in the heat and got their best results from a backup instrument. After months of analysis, Eddington and the Astronomer Royal, Frank Dyson, announced on 6 November 1919 that the measured deflection matched Einstein’s prediction rather than the Newtonian half-value.
The reaction was extraordinary. The world had just emerged from a war, and here was a British expedition confirming a German physicist’s theory. Newspapers across the world put it on the front page. Einstein, until then known only to other physicists, became the most famous scientist alive, a role he occupied for the rest of his life.
Modern historians have picked over the 1919 measurements and found the error bars uncomfortably large, with hindsight, for the confidence expressed. But the result was correct. Light bending has since been measured thousands of times, most precisely by radio astronomy and by the bending of light from distant galaxies around nearer ones, and general relativity passes every test. It is the theory of gravity on which all of modern cosmology stands.
The universe that would not stand still
In 1917, two years after publishing the theory, Einstein tried applying it to the whole universe. This was itself a new kind of ambition: a set of equations you could write down and ask what shape everything is.
He immediately hit a problem. His equations would not produce a stable universe. Fill space evenly with matter, and gravity pulls it all together; the universe must either collapse or fly apart. Since everybody knew the universe was static, eternal and unchanging, Einstein assumed his equations were missing something and added a term: a kind of universal springiness, a pressure built into empty space, which could be tuned to exactly balance gravity’s pull. He called it the cosmological constant.
It was a fudge, and worse, it was unstable, like a pencil balanced on its point. But it did the job, and it gave the answer everyone expected.
Others soon noticed that the equations, left alone, said something else. Alexander Friedmann, a Russian mathematician and former wartime balloon pilot, published solutions in 1922 showing that a universe filled evenly with matter must either expand or contract, and worked out how it would behave in each case. Einstein’s first response was to write a note claiming Friedmann had made an arithmetic error; he later withdrew it and admitted the solutions were correct, though he still thought them physically meaningless. Friedmann died of typhoid in 1925, aged thirty-seven.
Then came Georges Lemaître, a Belgian who was both a Catholic priest and a trained physicist, and who had studied under Eddington in Cambridge and worked at Harvard and MIT. Working independently of Friedmann, in 1927 he derived an expanding universe from Einstein’s equations, and did something Friedmann had not. He connected it to observations.
Lemaître knew of Slipher’s redshifts, and he knew of Hubble’s early distances. If space itself is expanding, he reasoned, then every galaxy should be moving away from every other, and the speed of recession should be proportional to distance: twice as far, twice as fast. He checked this against the data available in 1927, found it consistent, and even estimated the constant of proportionality.
Almost nobody read it. He had published in the Annals of the Scientific Society of Brussels, in French. When Einstein met him at a conference that year, he told Lemaître that his mathematics was correct but his physics was abominable.
Hubble’s law
Meanwhile, on Mount Wilson, Edwin Hubble and his assistant Milton Humason were doing the work. Humason had begun his career there as a mule driver carrying equipment up the mountain, then became a janitor, then a night assistant, and turned out to have a rare gift for coaxing spectra of faint galaxies out of the telescope on exposures lasting several nights. Hubble measured distances using Cepheids and other indicators; Humason measured redshifts.
In 1929 Hubble published a short paper with distances and velocities for two dozen galaxies. Plot one against the other, and the points scatter around a rising straight line. The further away a galaxy is, the faster it is receding.
What the telescope actually recorded was not speed but a shifted pattern of spectral lines. Take the spectrum of a nearby galaxy and the familiar lines of calcium and hydrogen sit almost where a laboratory puts them. Take a more distant one and the whole pattern has slid towards the red. Take one further still and it has slid further. The lines keep their spacing and their order, which is what shows that this is a shift of the whole spectrum rather than some change in the galaxy’s chemistry.
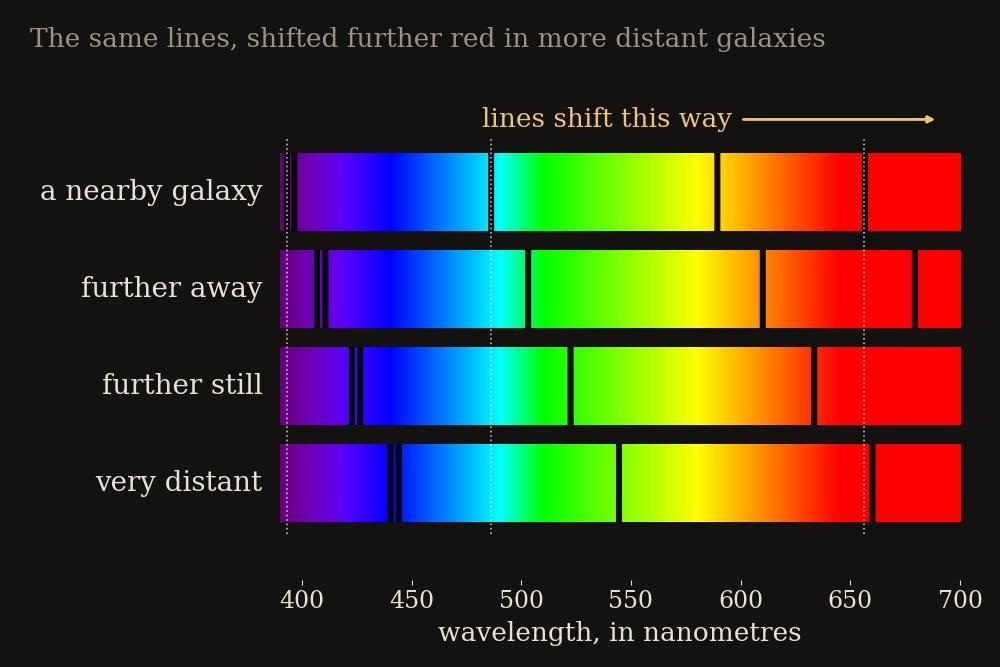
Figure F06-03. Redshift grows with distance. The same pattern of lines, shifted further red in each more distant galaxy. The pattern is unchanged, so the light itself has been stretched.
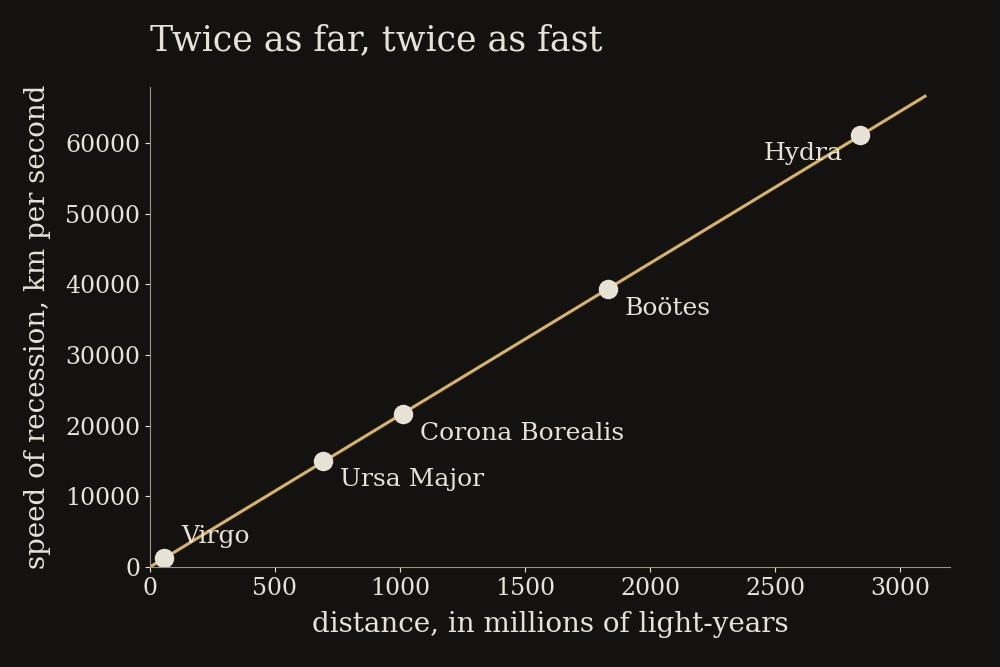
Figure F06-04. The expanding universe, in modern form. Five well-known galaxy clusters, plotted by distance and recession speed. Twice as far means twice as fast, which is the signature of expansion.
THE EQUATION — Hubble’s law
The speed at which a distant galaxy recedes equals its distance multiplied by a fixed number:
speed = H × distance
H is called the Hubble constant. It is not a speed but a rate of stretching, usually quoted in the awkward-looking units of kilometres per second per megaparsec, where a megaparsec is 3.26 million light-years. The modern value is about 70, which means that a galaxy 3.26 million light-years away recedes at about 70 kilometres per second, one twice as far recedes at 140, and so on.
Hubble’s own 1929 value was about 500, seven times too large, because his distances were far too small. That error had an awkward consequence, as the next box shows.
The result is usually credited to Hubble, and since 1929 it has been called Hubble’s law. Lemaître had published the same relation two years earlier, with a distance-speed constant of the right kind, and when his paper was translated into English in 1931 the paragraph containing the estimate was quietly left out. For decades this looked like a piece of Anglo-American sharp practice, until the correspondence was examined in 2011 and it turned out that Lemaître himself had done the translating, and had dropped the paragraph because by then Hubble’s better data had superseded his own estimate. In 2018 the International Astronomical Union recommended calling it the Hubble–Lemaître law.
What is actually expanding
It is very easy to picture this wrongly, and almost everyone does at first. The natural image is of galaxies hurtling outwards through space from some central point, like fragments of a bomb. That picture is wrong in two important ways.
First, there is no centre. Every observer, in every galaxy, sees all the others receding, with the most distant receding fastest. If we were at the centre of an explosion, we would see something quite different: galaxies on one side receding and those on the other approaching. We see recession in every direction, and so, we confidently expect, does an astronomer in any other galaxy.
Second, the galaxies are not really travelling through space. Space itself is expanding, and carrying them along. New space, so to speak, is appearing between them.

Figure F06-05. Raisin bread rising. Every raisin moves away from every other, and the further apart two raisins are, the faster the dough between them grows. No raisin is at the centre.
Two analogies help, and both are worth holding in mind.
Imagine a loaf of raisin bread rising in the oven. Sit on any raisin you like and watch the others. They all move away from you. A raisin twice as far off has twice as much dough between you and it, and that dough is expanding too, so it recedes twice as fast. That is Hubble’s law exactly. And no raisin is the centre of the loaf’s expansion; every raisin sees the same thing.
Now imagine the surface of a balloon with dots painted on it, and imagine that this two-dimensional surface is the whole of space, with no inside and no outside available to the inhabitants. Blow the balloon up. Every dot recedes from every other. The surface has no centre and no edge, yet it grows. This second analogy is better than the loaf in one respect: the loaf has an edge and a middle, and the universe does not.
A fair question follows. If space is stretching, why is the Earth not growing? Why are we not all slowly drifting apart, and why do atoms not swell?
The answer is that expansion only wins where nothing else is holding things together. Within a galaxy, gravity is overwhelmingly stronger than the gentle stretch of cosmic expansion, so galaxies do not expand. Neither do solar systems, planets, people or atoms, all of which are bound by gravity or by electrical forces far stronger than the effect. Even our own Local Group of galaxies, the Milky Way, Andromeda and their several dozen small companions, is bound together and is not expanding; Andromeda is in fact approaching us. The expansion shows itself only on the largest scales, between clusters of galaxies that are far enough apart for gravity between them to have lost the argument. Cosmology is a science of the very large precisely because that is the only place where the effect is visible.
KEY CONCEPT — The cosmological principle
Every equation in this chapter rests on an assumption, stated plainly: on a large enough scale, the universe looks the same everywhere and in every direction. It has no special places and no preferred directions. Astronomers call this the cosmological principle.
“Large enough” matters. On small scales the universe is obviously lumpy: there is a planet under you and a great deal of nothing above. But take a box a billion light-years on a side, put it anywhere in the universe, and it will contain much the same amount of matter, the same mix of galaxies and clusters, as a box placed anywhere else.
The principle began as an act of modesty, the assumption that our position is not special, which is the Copernican instinct applied to the whole universe. It has since been tested and largely confirmed: the afterglow of chapter 9 is even in temperature to about one part in a hundred thousand across the whole sky, and modern galaxy surveys find the same average density of galaxies wherever they look on large scales. If the principle were false, most of the reasoning in this book would collapse, so it is checked continually.
KEY CONCEPT — Cosmological redshift
Because space is stretching rather than galaxies flying through it, the redshift of a distant galaxy is not really a Doppler shift of the kind described in chapter 4.
Picture a light wave setting out from a distant galaxy billions of years ago. While it is in flight, the space it is travelling through stretches, and the wave stretches with it, like a wavy line drawn on a rubber band that is slowly pulled. It arrives with a longer wavelength than it started with: redder.
This gives the redshift a beautiful meaning. A galaxy with a redshift of 1 has had its light stretched to twice its original wavelength, which means the universe has doubled in size since that light set out. A redshift of 9, at the limit of what modern telescopes see, means the universe has grown tenfold since the light began its journey. Redshift is not really a speedometer. It is a measure of how much the universe has expanded while the light was on its way.
The awkward age
Turn Hubble’s law around and it says something remarkable about the past. If everything is moving apart, then everything was closer together yesterday, and closer still before that. Run the film backwards far enough and all the galaxies pile into the same place.
THE EQUATION — The age of the universe, roughly
Take a galaxy one megaparsec away, which is 3.26 million light-years, or about 31 million million million kilometres. It is receding at about 70 kilometres per second. How long would it have taken to get there, travelling at that speed?
Time equals distance divided by speed: 31 million million million divided by 70 gives about 440 million million million seconds, which is roughly 14 billion years.
Choose a galaxy ten times further away and it recedes ten times faster, so the answer comes out the same, which is the point. One simple division, using nothing but Hubble’s constant, gives an estimate of the time since everything was in the same place: about 14 billion years. The true figure, allowing for the fact that the expansion rate has changed over cosmic history, is 13.8 billion years. The rough calculation lands within a few per cent, which is a remarkable thing for a single division to do.
Do the same arithmetic with Hubble’s 1929 value of 500 and you get about two billion years. That was a serious problem. Geologists using radioactive dating already knew that rocks on Earth were older than that. A universe younger than the planet it contains is not a small discrepancy, and it was used for two decades as an argument against the whole idea of an expanding universe. The error lay in Hubble’s distance scale, which was too short by a factor of about seven, partly because of the confusion between the two kinds of Cepheid described in chapter 5 and partly because what he took for bright single stars in distant galaxies were sometimes whole glowing clouds. As the distance ladder was rebuilt through the 1950s and after, the age problem dissolved.
Einstein, for his part, came to accept the expanding universe after visiting Mount Wilson in 1931 and discussing the observations with Hubble. He dropped the cosmological constant from his equations, and according to a story told by the physicist George Gamow he called it the biggest blunder of his life. Whether or not he used those words, the term went out of fashion for sixty years. Chapter 11 describes how it came back.
There is an Irish footnote to the theory of the expanding universe. In 1934 the Dublin-born astronomer William McCrea, working with Edward Milne, showed that the main results could be derived using nothing but Newton’s laws applied to an expanding ball of matter. The full theory needs general relativity, but their work made the expanding universe far easier to teach and to think about, and their version is still the one used to introduce the subject.
Where things stood in 1935
Within a single decade the universe had acquired a history.
Space and time had turned out to be a single flexible thing, bent by matter. Gravity was geometry. The universe as a whole was not static but expanding, and the expansion was not galaxies flying through space but space itself stretching, with no centre and no edge. Light from distant galaxies arrived stretched in proportion to how much the universe had grown while it travelled.
And running the expansion backwards implied something that made many scientists deeply uncomfortable: a beginning. Lemaître had already said it out loud. In 1931 he proposed that if the universe has been expanding, then at some finite time in the past everything must have been packed into a single quantum of unimaginable density, which he called the primeval atom. The universe, he suggested, began with its disintegration: a day without a yesterday.
To many physicists this smelled of theology, all the more so coming from a priest. There had to be a way of avoiding it. For the next thirty years, the argument about whether the universe had a beginning would be the central question in cosmology.
Chapter 7 — Big Bang or Steady State?
“The evolution of the world can be compared to a display of fireworks.” — Georges Lemaître, 1931
A day without a yesterday
If the universe is expanding, it was smaller yesterday. Push that far enough into the past and you reach a moment when everything now visible was packed together at enormous density. Lemaître said so plainly in 1931: the universe began with the disintegration of what he called the primeval atom, a single dense object whose break-up produced everything since.
Many physicists disliked this intensely, and their reasons were not all bad ones.
The first was the age problem from chapter 6. With Hubble’s overlarge value for the expansion rate, the universe came out about two billion years old, younger than rocks that geologists had already dated. Any theory with that flaw looked broken.
The second was philosophical. Science explains events by what came before them. A moment with nothing before it is not an explanation but the absence of one, and it looked suspiciously like a creation story dressed in mathematics, particularly when proposed by a Catholic priest. Lemaître himself was careful about this, and argued firmly that his cosmology was a physical hypothesis, not a theological claim, and that scientists should not read religion into it. But the suspicion stuck.
The third objection was practical: the idea made no testable predictions. Saying that everything was once compressed is not a scientific theory until you can say what that compression would have done, and how we might see the evidence today. That last gap is what a Russian-born émigré with a taste for practical jokes set out to fill.
Cooking the elements
George Gamow had studied under Friedmann in Leningrad, escaped the Soviet Union in 1933 after two failed attempts to cross borders by kayak, and settled in America. He was a serious physicist and an incorrigible comedian, which cost him some credibility and won him a great many readers.
Gamow’s question was: what would a hot, dense early universe have done? His answer, developed with his graduate student Ralph Alpher, was that it would have cooked the chemical elements. In the first minutes, when the whole universe was hotter than the inside of a star, protons and neutrons would have fused together. Work out the nuclear physics, and you can predict how much of each element should have been made.
The resulting paper appeared in 1948. Gamow, unable to resist, added the name of his friend Hans Bethe, who had done none of the work, so that the three authors would be Alpher, Bethe and Gamow. It was published on 1 April.
The calculation worked beautifully for the lightest elements and failed for everything else. There are no stable atomic nuclei with five or eight particles in them, and in the rapidly cooling early universe there was no way to leap that gap. So the early universe could make hydrogen, a great deal of helium, and traces of lithium, and then stop. Gamow’s hope of explaining the whole periodic table was dead.
What survived was a firm prediction: the universe should be about three-quarters hydrogen and one-quarter helium by mass, and that ratio should be roughly the same everywhere, because it was fixed before any star existed. As chapter 4 recorded, Cecilia Payne had already shown that stars are overwhelmingly hydrogen and helium, in about that proportion.
Alpher, working with Robert Herman, then took the next step, and it is one of the great neglected predictions in the history of science. If the early universe was that hot, it was filled with intense radiation. That radiation could not have gone anywhere; the universe has no outside. It must still be here, stretched by the expansion into something much colder and longer in wavelength. In 1948 they estimated its present temperature at about five degrees above absolute zero, which would put it in the microwave band.
Nobody looked. Radio astronomy was in its infancy, the prediction was buried in papers about nuclear physics, and Gamow’s reputation for jokes did not help. For seventeen years the most important observational prediction in cosmology sat unread.
THE EQUATION — Cooling by stretching
Chapter 6 showed that light stretches as the universe expands. Radiation’s temperature depends directly on its wavelength: stretch the waves and the radiation cools. The rule is as simple as it could be.
If the universe doubles in size, the radiation filling it halves in temperature.
An example that matters later. The early universe became transparent when it had cooled to about 3,000 degrees, hot enough to glow orange-white. Since then the universe has grown about 1,100 times larger. Divide 3,000 by 1,100 and you get about 2.7. That is the predicted present temperature of the leftover glow: 2.7 degrees above absolute zero, which is minus 270 Celsius. Keep that number in mind for the end of this chapter.
A universe without a beginning
While Gamow’s group was calculating, three men in Cambridge were building the rival theory, and the story of how they started it is famous. Hermann Bondi, Thomas Gold and Fred Hoyle had worked together on radar during the war and continued meeting afterwards. In 1947 they went to see a ghost film, Dead of Night, whose ending returns to its beginning so that the story can run forever. Gold asked on the way home: what if the universe were like that?
The result, published in 1948, was the steady state theory. It accepted that the universe is expanding. It denied that this implies a beginning. Instead it proposed that as galaxies move apart, new matter comes quietly into being in the gaps, at exactly the rate needed to keep the average density of the universe constant. New matter gathers into new galaxies, which fill the widening spaces, so that the universe always looks much the same however far back or forward you go.
The creation rate required is absurdly small: about one hydrogen atom per cubic metre of space every billion years or so. No experiment could ever detect it. Critics objected that creating matter from nothing violates the conservation of energy, to which the steady state theorists replied that the Big Bang proposed to create everything from nothing in a single instant, which was hardly more respectable.
The theory had real virtues. It was elegant. It extended the cosmological principle of chapter 6 to time as well as space, proposing that the universe looks the same at all epochs, which its authors called the perfect cosmological principle. It made the age problem vanish, since an eternal universe cannot be younger than its rocks. Above all, unlike its rival, it was sharply testable, because it forbids the distant past from looking any different from the present. One clear example of cosmic change would kill it.
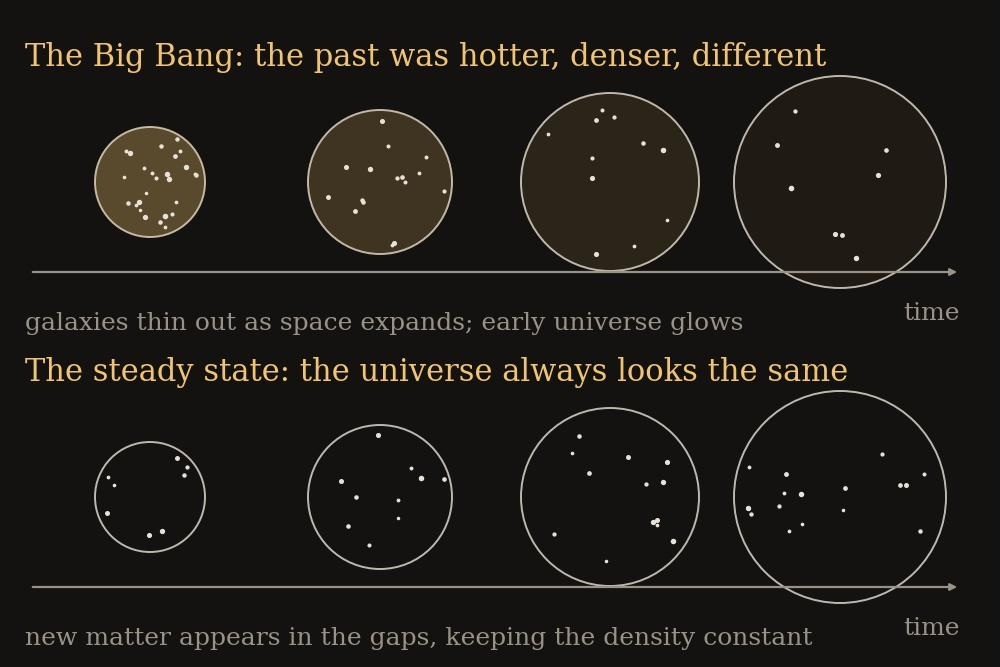
Figure F07-01. The two rival universes. In the Big Bang the past was hotter, denser and different; in the steady state the universe looks the same forever, with new matter appearing to fill the gaps.
It was Fred Hoyle who gave the other theory its name. In a BBC radio series in 1949, explaining the alternatives to a general audience, he described the rival idea as one in which all the matter of the universe was created in one big bang at a particular time. The phrase stuck, to Hoyle’s lasting irritation. He always denied he had meant it as an insult, and said he was reaching for a vivid image for radio listeners. Either way, the theory he opposed has been called the Big Bang ever since, and the name is a poor one, for reasons worth spelling out.
KEY CONCEPT — What the Big Bang theory does and does not say
It is not a theory of an explosion in space. There was no bomb, no bang, no centre from which debris flew outwards into a waiting void. The theory says that space itself was once far more compressed, everywhere at once, and has been expanding ever since. The expansion happened, and is happening, everywhere. Wherever you stand, the matter around you was once densely packed in that same place.
It is not a theory of the beginning of the universe. It describes how the universe evolved from a hot, dense early state to the one we see now. What produced that state, whether time itself had a start, and what if anything came before it are separate questions, tackled in chapter 22. A physicist saying “the Big Bang” usually means the hot dense phase and everything since, not a creation event.
What it is is a description of cosmic history with a very large number of testable consequences, of which this chapter reaches the first two: the amount of helium in the universe, and a faint glow left over from when the whole of space was hot.
Hoyle’s revenge, and how the elements were really made
Hoyle spent much of the 1950s proving something that his opponents needed. If the elements beyond helium were not cooked in a hot early universe, where did the carbon in your body and the iron in your blood come from? His answer: inside stars.
Building carbon is the hard step, the one that stumped Gamow, because it needs three helium nuclei to meet almost simultaneously. Hoyle argued that this could happen at a useful rate only if the carbon nucleus has a particular energy state, at just the right energy, to catch the reaction. No such state was known. Hoyle went to the nuclear physicists at Caltech and badgered them into looking for it. They found it, almost exactly where he said it would be. It remains one of the boldest successful predictions in physics.
In 1957 Hoyle, with Margaret Burbidge, Geoffrey Burbidge and William Fowler, published a monumental paper showing in detail how stars build the elements from carbon up to iron, and how exploding stars make the rest. It is universally known by the authors’ initials as B2FH, and it is essentially correct. Every atom of carbon, oxygen, calcium and iron in your body was made inside a star that died before the Sun was born. Chapter 15 tells that story, and the companion volume tells it from the atom’s point of view.
The irony is complete. Hoyle, the great opponent of the Big Bang, solved the problem that his opponents’ theory could not, and in doing so cleared away the last reason to expect the early universe to make anything heavier than lithium. But helium remained. Stars do make helium, but not nearly enough: measure the helium in the oldest, most pristine gas in the universe and it comes out around a quarter by mass, far more than generations of stars could have produced, and remarkably uniform from place to place. The simplest explanation was Gamow’s. Something made helium everywhere, before there were any stars.
There is a postscript to B2FH that still causes arguments. When the Nobel Prize was awarded in 1983 for work on how the elements are made, it went to William Fowler and not to Hoyle, whose idea it had largely been. Many physicists thought the omission was punishment for Hoyle’s stubbornness over the Big Bang, and for a separate row in which he had publicly accused the Nobel committee of overlooking Jocelyn Bell, whose story is in chapter 16. Hoyle spent his later years proposing increasingly unorthodox ideas, including that life arrived on Earth from space, and died in 2001 still unconvinced about the Big Bang. His work on the elements remains one of the towering achievements of twentieth-century science.
KEY CONCEPT — Predicting beats explaining
Both rival theories could account for the facts known in 1950. What separated them, in the end, was that one of them had stuck its neck out.
Alpher and Herman calculated in 1948 that the universe should be bathed in radiation at a few degrees above absolute zero. Nobody had seen any such thing, and they had no way to look for it. When it was found seventeen years later, at close to the predicted temperature, it counted enormously in the theory’s favour, because there was no possibility that the prediction had been shaped to fit the result.
The steady state, by contrast, had to be modified after the fact to accommodate the microwave background, and the modifications were ingenious but unconvincing. A theory adjusted to fit a new fact is weaker than a theory that called the fact in advance, even when both end up agreeing with the data. This is the single most useful test to apply to any scientific claim: did it stick its neck out before the evidence arrived?
Voices from the radio sky
The decisive evidence, though, came from a new way of looking at the sky.
In 1933 Karl Jansky, an engineer at Bell Telephone Laboratories investigating static that interfered with transatlantic radio calls, found a hiss that rose and fell once a day and traced it to the centre of the Milky Way. Radio astronomy was born by accident, in the course of debugging a telephone system, and it would produce almost every major cosmological discovery of the next forty years. Hardly anyone followed it up until after the war, when surplus radar equipment and trained operators were suddenly available.
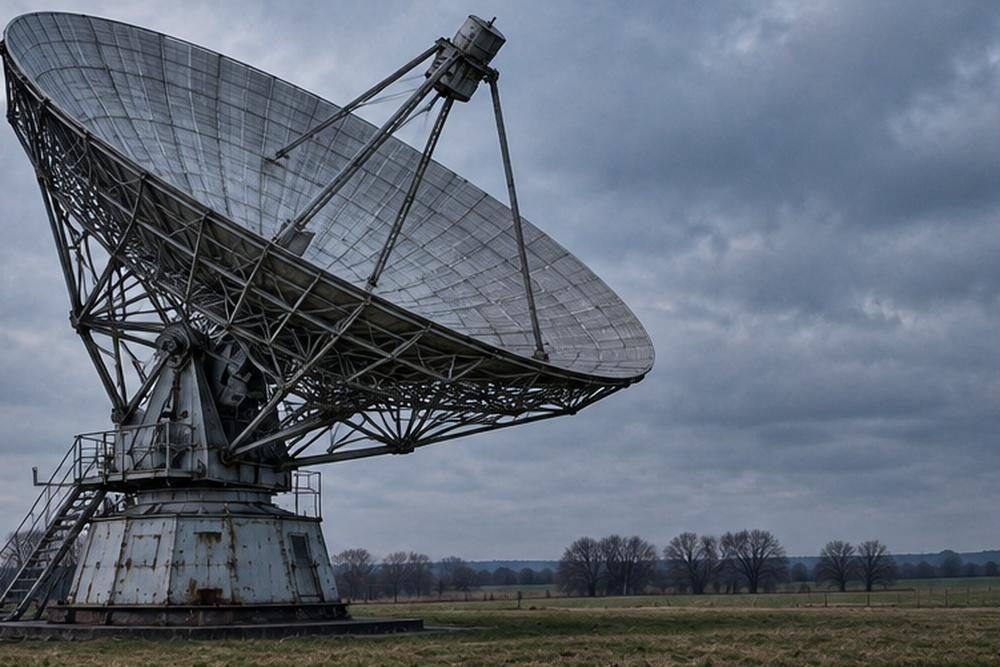
Figure F07-02. Post-war radio astronomy. Wartime radar skills and surplus equipment turned into a new science, and it was radio astronomers who settled the argument about the origin of the universe.
At Cambridge, Martin Ryle built a series of increasingly capable radio telescopes and set out to count radio sources. This turned out to be a cosmological experiment. Faint sources are, on average, further away, and the further away you look, the further back in time you see. So if you count how many sources there are at each level of brightness, you are measuring whether the universe was different in the past.
The counts did not match the steady state. There were far more faint sources than an unchanging universe allowed, meaning the distant past contained a higher density of radio-loud objects than the present. Ryle announced this in the mid-1950s, in terms that Hoyle, at the same university, took personally. The public feud between them ran for years, and was not helped by the fact that Ryle’s earlier counts had contained real errors, which Hoyle seized on. But the later, better counts held up.
Then came the quasars. Radio surveys had turned up sources that looked, on photographs, like ordinary faint stars. In 1963 Maarten Schmidt at Palomar took a spectrum of one of them, known by its catalogue number 3C 273, and was baffled by its lines until he realised they were ordinary hydrogen lines shifted enormously to the red. The object was receding at about a sixth of the speed of light, which by Hubble’s law put it some two billion light-years away.
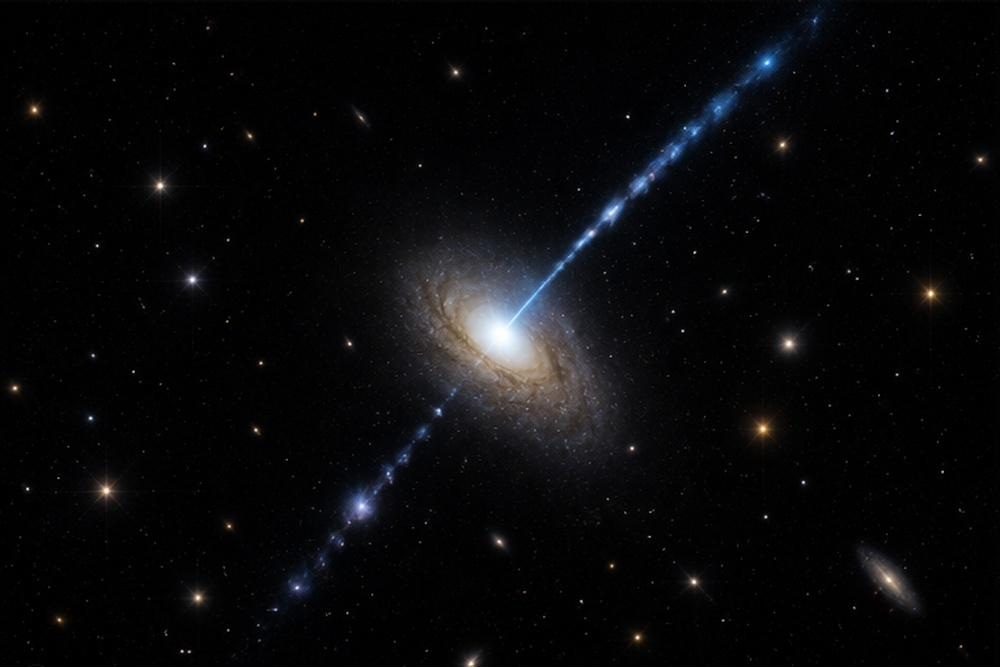
Figure F07-03. A quasar. Far brighter than a whole galaxy yet no bigger than a solar system, quasars exist in the distant past and not nearby, which is by itself evidence that the universe changes with time.
To be visible at that distance, 3C 273 had to be pouring out more light than a hundred galaxies from a region small enough to vary in brightness over weeks, which means no larger than a few light-weeks across. Nobody knew what could do that; the answer, a supermassive black hole swallowing matter, took another decade and belongs to chapter 17. For cosmology the crucial point was simpler. Quasars are common at great distances and absent nearby. The universe used to be full of them and no longer is. That is cosmic change, plainly visible, and the steady state forbids it.
The pigeons of Holmdel
The final blow came, like Jansky’s discovery, from Bell Labs, and again from engineers trying to get rid of noise.
At Holmdel in New Jersey stood a horn antenna, a giant metal ear shaped like a cornucopia, built for early satellite communications and now available for radio astronomy. In 1964 two young radio astronomers, Arno Penzias and Robert Wilson, set about calibrating it with great care. They wanted to measure faint radio emission from the Milky Way, which meant accounting for every source of noise in the system.
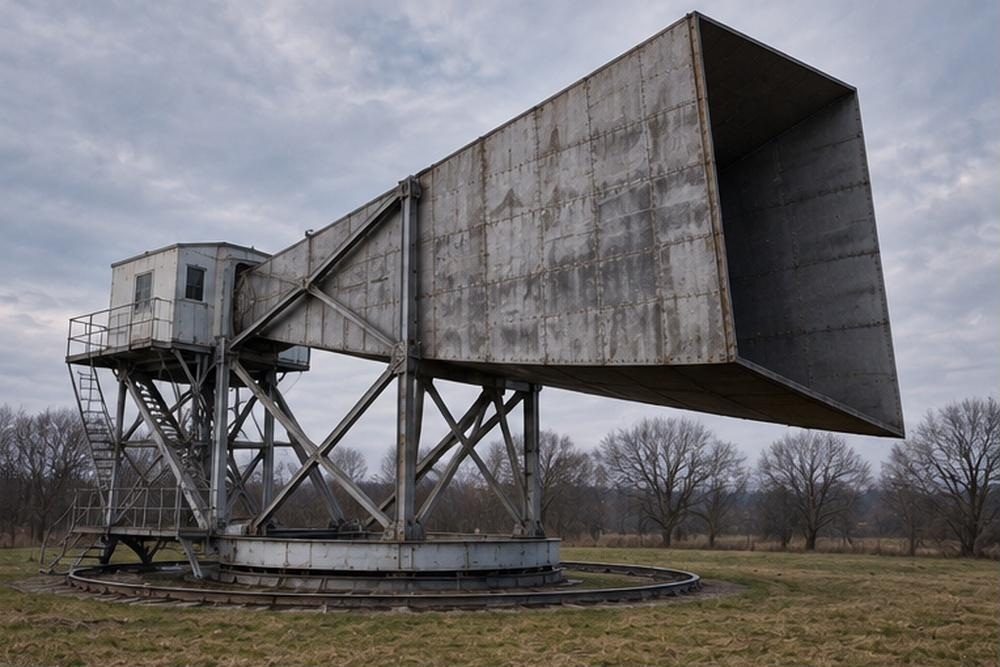
Figure F07-04. The Holmdel horn antenna. Built for satellite communications, it detected a faint hiss coming from every direction in the sky, which turned out to be the oldest light in the universe.
There was a hiss they could not remove. It was equivalent to a temperature of about three and a half degrees above absolute zero, it did not vary with the time of day or the season, and it came from every direction equally. They checked the electronics. They cooled the amplifiers. They found a pair of pigeons nesting in the throat of the horn and evicted them, then cleaned out what Penzias delicately described in a memo as a white dielectric material. The pigeons came back; they were dealt with less gently the second time. The hiss remained.
Thirty miles away at Princeton, Robert Dicke had independently reasoned that a hot early universe should have left radiation behind, had put his young colleagues Jim Peebles, Peter Roll and David Wilkinson to work building an antenna to look for it, and was within months of switching it on. A mutual acquaintance suggested that Penzias telephone him. Dicke took the call, listened, put the phone down and said to his team that they had been scooped.
The two groups published side by side in 1965: Penzias and Wilson describing an unexplained excess temperature, Dicke’s group explaining what it was. The measured temperature settled at 2.7 degrees above absolute zero, almost exactly the value that comes out of the simple arithmetic in the equation box above, and very close to what Alpher and Herman had predicted seventeen years earlier and nobody had bothered to test.
Penzias and Wilson received the Nobel Prize in 1978. Alpher and Herman did not, and were, understandably, bitter about it for the rest of their lives.
There is one homely fact about this radiation that is worth knowing, because it makes the whole thing concrete. Until analogue television was switched off, if you tuned an ordinary set to a channel with no station, a small fraction of the snow on the screen and the hiss from the speaker was this radiation: light from the young universe, arriving after thirteen and a half billion years and being turned into static in a living room. It is falling on you as you read. About a thousand particles of light from the early universe pass through every cubic centimetre of the room you are sitting in, all the time, coming equally from every direction.
The end of the argument
The cosmic microwave background, as the glow is now called, finished the steady state as a serious theory. In a Big Bang universe it is exactly what must be there: light released when the whole of space cooled enough to become transparent, stretched by the expansion from orange-white heat down to microwaves. In a steady state universe there is no natural way to produce a smooth bath of radiation at a single temperature filling all of space. Hoyle spent decades proposing alternatives, including tiny iron needles in intergalactic space that might absorb starlight and re-radiate it, and never persuaded anyone.
Three pieces of evidence now pointed the same way: the expansion itself, the universal helium abundance, and the microwave background. A fourth, that the distant universe looks different from the nearby one, had come from Ryle’s counts and the quasars. Within a few years of 1965, essentially the whole community had moved.
It is worth saying that the steady state theory was not a foolish idea, and that the argument was good for science. It was proposed for sound reasons at a time when the rival theory had a serious flaw, it was sharply testable, and its proponents did first-rate physics in defending it, including the explanation of how the elements are really made. It lost because it was checked, which is the highest compliment available to a scientific theory.
Where things stood in 1970
Part I of this book has covered five thousand years, from a sunbeam in a stone passage to a hiss in a metal horn. By 1970 the shape of the modern picture was in place.
The universe is expanding, and was therefore once hot and dense. It is about ten to fifteen billion years old, the exact figure still disputed. It contains billions of galaxies, each with billions of stars, arranged with no centre and no edge that anyone could see. Its lightest elements were forged in the first few minutes; the rest were made inside stars and scattered by their deaths. It is bathed everywhere in a faint microwave glow that is the cooled remnant of its own hot youth, released when the universe was less than half a million years old.
That last fact is the greatest gift in cosmology, because that glow is a photograph. It is light that has travelled to us, essentially undisturbed, from the young universe, and it carries a detailed record of what conditions were like when it set out. Part II of this book begins by reading it.
Part II — The Universe We Know
Chapter 8 — The First Few Minutes
“The universe is not only queerer than we suppose, but queerer than we can suppose.” — J. B. S. Haldane, 1927
Winding back the clock
Part I ended with the evidence for a hot, dense beginning: the expansion, the helium, the microwave glow. This chapter takes that evidence seriously and asks what actually happened, in order, from the earliest moment physics can describe to the switching on of the first stars.
Everything here follows from two things. The universe is expanding, so it was denser in the past. And compressing things makes them hot, as anyone who has pumped up a bicycle tyre and felt the pump warm in their hand has noticed. Run the expansion backwards, and the universe gets denser and hotter without limit.
That gives cosmology an unusual advantage. Hot, dense matter is simple. A star is complicated, a planet more so, a living cell almost unimaginably so, but a uniform gas at ten billion degrees has almost no structure to worry about, and its behaviour follows from nuclear physics that can be checked in a laboratory. The early universe is the easiest part of cosmic history to calculate. It is later, when gravity starts clumping matter into galaxies and stars, that things get messy.
A word about how the timings are stated. Physicists label eras by temperature and by time since the beginning, and the two go together: the hotter, the earlier. When this chapter says “one second”, it means one second after the start of the expansion, which is a strange thing to be able to write in a sentence and mean precisely.
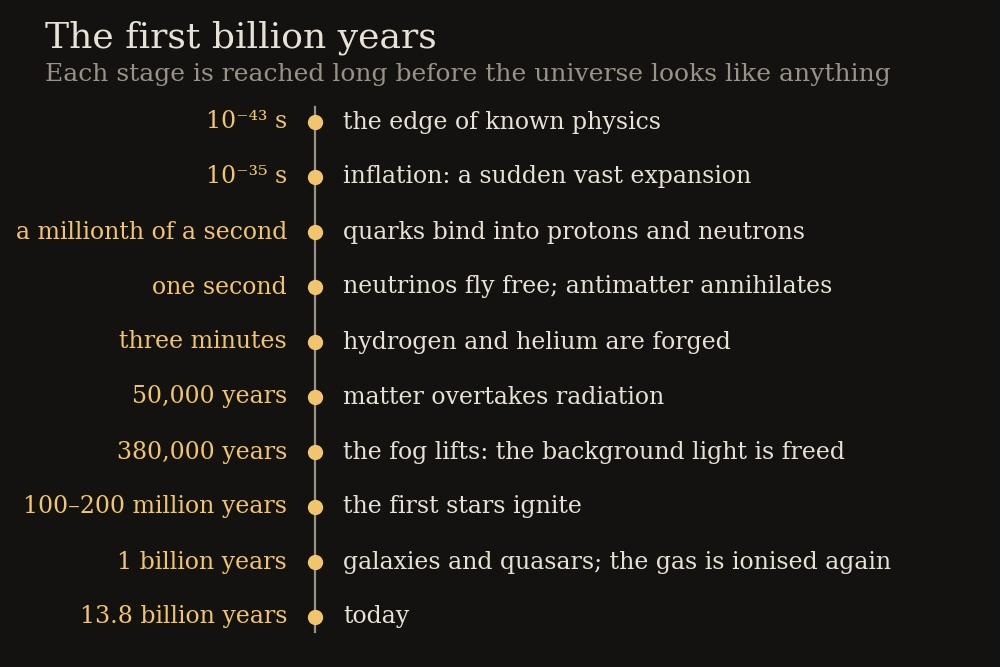
Figure F08-01. The first billion years, on a scale where each step is ten times longer than the last. Almost everything fundamental happened in the first few minutes; almost everything visible came much later.
The first instant, and what we cannot say
Wind back to 10⁻⁴³ seconds, a number with forty-two zeros between the decimal point and the one. This is the Planck time, and it marks the edge of the map.
At that point the universe was so dense that gravity would have been as strong as the forces inside an atomic nucleus, and no current theory can handle that. General relativity, which governs gravity and large scales, and quantum mechanics, which governs the very small, give contradictory answers when both apply at once. What is needed is a theory of quantum gravity, and despite fifty years of effort there is not yet a working one. Chapter 22 describes the attempts.
So the honest position is this. Cosmology does not claim to know what happened at the very start, or whether “the very start” is even a meaningful phrase. What it claims is a detailed and testable account of everything from a tiny fraction of a second onwards. That is a more modest claim than the phrase “theory of the origin of the universe” suggests, and a much better supported one.
The earliest event the standard picture does describe is inflation, an extraordinary burst of expansion somewhere around 10⁻³⁵ seconds, which chapter 12 explains in full. For now, one consequence matters: inflation left the universe hot, almost perfectly uniform, and filled everywhere with a soup of the most elementary particles.
The particle soup
By 10⁻¹² seconds, a trillionth of a second in, conditions were about as extreme as those recreated in the Large Hadron Collider, and from here on the physics is experimentally tested rather than theoretical.
The universe was a plasma of quarks, electrons, their antimatter counterparts, and the particles that carry forces between them, all at temperatures of many trillions of degrees, colliding, annihilating and being created again. There were no atoms, no nuclei, not even protons: at these energies a proton could not hold together for an instant.
Figure F08-02. The early universe had no structure worth the name: a uniform, opaque, ferociously hot soup of elementary particles, the same everywhere.
At about a millionth of a second, with the temperature down to some ten trillion degrees, the quarks could finally bind together in threes. Protons and neutrons came into existence, and so did their antimatter equivalents. Then matter and antimatter set about annihilating each other, each pair vanishing in a flash of radiation.
KEY CONCEPT — Why there is anything at all
Matter and antimatter are produced in equal amounts in every laboratory experiment ever done. A particle of matter meeting its antiparticle annihilates completely, converting both into radiation.
If the early universe had contained exactly equal amounts, everything would have annihilated and the universe today would contain nothing but light. It plainly does not. So there must have been a slight excess of matter: for roughly every billion antiparticles there were a billion and one particles. The billion pairs annihilated; the one left over is what everything you have ever seen is made of. You, the Earth and the stars are the rounding error.
Why the imbalance? Nobody knows. It requires the laws of physics to treat matter and antimatter slightly differently, and a small difference of exactly this kind has been observed in particle accelerators, in the decay of certain exotic particles. But the measured effect is far too small to account for the imbalance we need. This is one of the genuine unsolved problems in physics, and it is not a detail: it is the question of why there is any matter at all.
By about one second, the temperature had fallen to ten billion degrees. Two things happened almost at once. Electrons and their antimatter twins, the positrons, annihilated in their turn, leaving the small excess of electrons that still exists. And the neutrinos, ghostly particles that barely interact with anything, stopped interacting altogether and simply flew free.
Those neutrinos are still flying. There should be about three hundred of them in every cubic centimetre of space, a relic even older than the microwave background, released when the universe was one second old. They are far too feeble to detect directly with present technology, though their gravitational effect on how matter clumped has been measured, which is a startling thing to be able to say.
It is worth pausing on what that means. Neutrinos interact so weakly that a typical one could pass through a light-year of solid lead without noticing. Trillions from the Sun pass through your body every second, day and night, the ones at night having travelled through the entire Earth on the way. The relic neutrinos from the first second are colder and even harder to catch, and detecting one directly remains an unsolved experimental challenge. Yet there are so many of them that their combined gravity has visibly slowed the growth of galaxy clusters, and from that effect cosmologists can put limits on how much a neutrino weighs, a measurement that particle physicists have never managed in a laboratory. Chapter 14 describes how this has recently turned into one of the sharpest puzzles in the subject.
Three minutes to make the elements
Now the universe was cool enough for protons and neutrons to stick together, and for a few minutes it worked as a nuclear reactor.
The ingredients were set by what had gone before. At very high temperatures protons and neutrons convert freely into one another, and they exist in roughly equal numbers. As the universe cooled, the conversions became harder in one direction than the other, because a neutron is very slightly heavier than a proton and it costs energy to make one. By the time the conversions effectively stopped, at around one second, there was about one neutron for every six protons. Free neutrons are unstable and decay in about fifteen minutes, so the ratio kept slipping, reaching roughly one in seven by the time fusion began.
Fusion could not start immediately, because the first step, joining a proton and a neutron to make deuterium (heavy hydrogen), produces a nucleus so fragile that the surrounding radiation smashed it apart as fast as it formed. This delay is called the deuterium bottleneck, and it held until the temperature dropped below about a billion degrees, roughly three minutes in.
Then everything happened at once. Deuterium survived, and was immediately built up into helium, which is far more robust. Essentially every available neutron ended up inside a helium nucleus. With one neutron for every seven protons, the arithmetic gives helium as about a quarter of the mass, with the remaining three-quarters hydrogen, which is exactly what the universe is observed to contain.
Building anything heavier failed, for the reason chapter 7 gave: there are no stable nuclei with five or with eight particles, and the universe was thinning and cooling too fast to leap the gap. Tiny amounts of lithium were made, and traces of deuterium and of light helium survived unprocessed. By about twenty minutes it was all over, and the composition of the universe was fixed until the first stars began to change it hundreds of millions of years later.
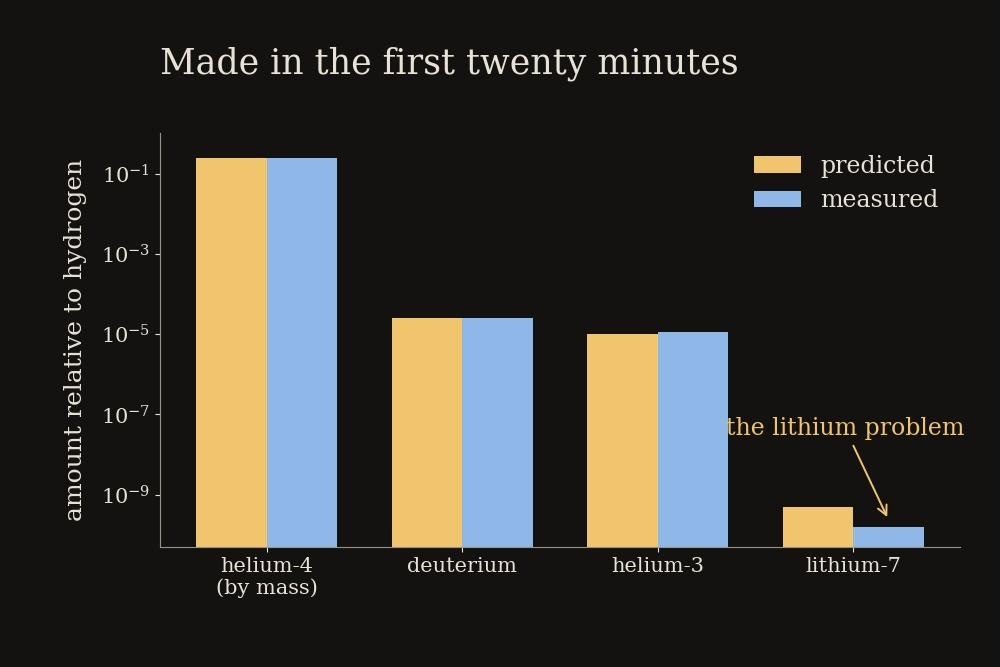
Figure F08-03. Prediction against measurement for the light elements. The amounts span ten powers of ten, and the theory matches observation for three of them; lithium remains a puzzle.
This is one of the great successes of modern science, and it is worth being precise about why. The theory has essentially one adjustable number: how much ordinary matter the universe contains. Fix that one number, and the amounts of helium, deuterium, light helium and lithium are all predicted, with no further freedom. Those amounts differ from one another by a factor of ten thousand million. Three of the four match the measurements.
The fourth does not. The amount of lithium-7 observed in the atmospheres of the oldest stars is about three times less than predicted. This is the lithium problem, and it has resisted explanation for twenty-five years. It may be that old stars slowly destroy their own lithium, hiding the original amount. It may be a subtle error in the nuclear reaction rates. It may, just possibly, be a hint of new physics in the early universe. Nobody knows, and it is a good example of how a mature scientific theory usually holds one loose thread that its practitioners are honest about.
There is a bonus. Because the predicted amounts depend on how much ordinary matter there is, measuring the deuterium in pristine intergalactic gas amounts to weighing all the ordinary matter in the universe. The answer, confirmed by a completely independent method in the next chapter, is that ordinary matter, the stuff of atoms, makes up only about 5 per cent of the total content of the universe. Chapters 10 and 11 deal with the rest.
The fog lifts
For the next few hundred thousand years, nothing dramatic happened, and the universe was a hot fog.
One quiet change did occur, and it mattered. In the early universe, radiation carried more energy than matter did, and radiation dominated the behaviour of everything: its pressure resisted any attempt by gravity to gather matter into clumps. But radiation loses energy as space expands faster than matter does, because it is not only diluted but also stretched and reddened. So there came a moment, at about fifty thousand years, when the balance tipped and matter took over as the dominant contents of the universe. Only after that could gravity begin, slowly, to assemble structure. The moment is invisible to the eye but leaves a clear fingerprint in the patterns of the microwave background, and it is one of the numbers cosmologists measure.
The fog itself persisted.
The fog contained hydrogen and helium nuclei, free electrons, and an overwhelming amount of radiation. Light could not travel far, because free electrons scatter light very efficiently; a particle of light would fly a short distance, bounce off an electron, fly again, bounce again. The universe was opaque, in the same way and for a similar reason that a thick fog is opaque, and it glowed like the inside of a furnace.
Then, at about 380,000 years, the temperature fell to roughly 3,000 degrees, and electrons could at last be captured and held by nuclei to form complete, neutral atoms. Astronomers call this recombination, which is an odd name since nothing had ever been combined before, but it has stuck.
The effect on light was sudden and total. With the free electrons mopped up into atoms, there was nothing left to scatter light, and the universe became transparent from one moment to the next. The radiation that had been bouncing endlessly between electrons was suddenly free to travel in a straight line, and most of it has been travelling ever since.
That radiation is the cosmic microwave background of chapter 7. When it was released it was orange-white, the colour of a glowing electric hotplate. The expansion has stretched it by a factor of about 1,100, cooling it to 2.7 degrees above absolute zero, which puts it in the microwave band.
KEY CONCEPT — The wall of fire
When you look at the microwave background, you are looking at a surface, and it is worth being clear about what kind of surface.
Look in any direction, far enough, and your line of sight eventually reaches a distance where the universe was still foggy. You cannot see any further, because at that point the universe was opaque. So the sky has a wall at that distance in every direction, and the wall glows.
This surface is called the surface of last scattering, and it is not a physical object sitting somewhere. It is the boundary of what is visible, in the same way that the horizon at sea is not a wall of water but the limit of the view. Nor is it stationary: every year we see a slightly different layer, as light from very slightly further away arrives. Every observer, everywhere in the universe, is surrounded by their own wall of fire at the same distance.
It is the oldest light there is, and it fixes the outer boundary of what can ever be seen with light: chapter 20 returns to this.
The dark ages
After recombination, the universe was a very strange place: transparent, but with nothing in it that shone.
The radiation was still there, but it was cooling and reddening out of the visible range within a few million years. There were no stars, no galaxies, no quasars. There was just a vast, expanding, gradually cooling sea of hydrogen and helium gas, faintly lumpy, getting darker all the time. Astronomers call this period the dark ages, and it lasted somewhere between a hundred and two hundred million years.
Figure F08-04. The dark ages. For more than a hundred million years the universe contained nothing that shone: cooling gas, darkness, and gravity quietly at work.
Quietly, though, gravity was working. The gas was not perfectly smooth; it carried faint ripples of slightly higher and slightly lower density, whose origin is described in chapter 12 and whose imprint is still visible in the microwave background. Anywhere slightly denser than average pulled in a little more material than its surroundings, which made it denser still, which made it pull harder. Over millions of years these slight over-densities grew into dense clumps of gas.
This is the fundamental engine of cosmic structure, and it runs on one fact: gravity is unstable. Any small lump grows. Chapter 10 shows that the process needed help from an invisible kind of matter to work fast enough, but the principle is simple enough, and everything you can see in the universe was assembled by it.
First light
When a clump of gas grows dense enough, its centre becomes hot enough for hydrogen nuclei to fuse, and a star switches on.
The first stars, somewhere between a hundred and two hundred million years after the beginning, were not like the Sun. They formed from gas containing only hydrogen and helium, with none of the heavier elements that help gas clouds cool and fragment today. Without efficient cooling, the clouds tended to collapse into very large single objects. Models suggest the first stars were monsters, tens or even hundreds of times the mass of the Sun, blazing blue-white, burning through their fuel in a few million years and dying in colossal explosions.
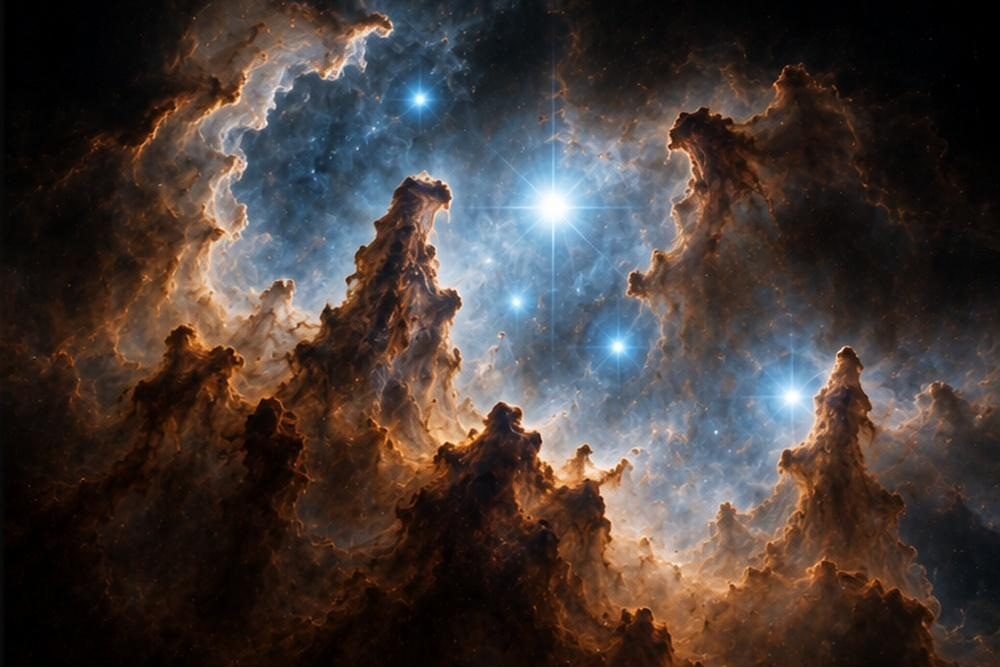
Figure F08-05. First light. The earliest stars were far more massive than the Sun, short-lived and brilliant, and their deaths seeded the universe with the first heavy elements.
Those explosions mattered enormously. They scattered the first carbon, oxygen and iron into a universe that had contained none, beginning the enrichment that would eventually make rocky planets and biology possible. And the ultraviolet light of the first stars and the first quasars began stripping electrons back off the hydrogen atoms that had formed at recombination, a process called reionisation, which spread outwards from the first luminous objects in expanding bubbles until, by about a billion years after the beginning, the bubbles had merged and the gas between the galaxies was ionised again, as it remains today.
No one has yet seen a first-generation star. They were brief, distant and long gone. The most promising way to study the dark ages is not to look for stars but to listen for the hydrogen itself, which emits faint radio waves at a wavelength of 21 centimetres, stretched by the expansion to metre wavelengths by the time it reaches us. Several radio experiments are hunting for this signal, and chapter 14 reports on how they are getting on.
The James Webb Space Telescope, launched at the end of 2021, sees galaxies already formed and shining about three hundred million years after the beginning, which is uncomfortably early and is one of the live puzzles of current cosmology. Chapter 18 returns to it.
The cosmic calendar
Thirteen point eight billion years is not a number anyone can feel. The best remedy, popularised by Carl Sagan, is to squeeze the whole of cosmic history into a single calendar year, with the beginning at midnight on 1 January and the present moment at midnight on 31 December.
On that scale, one day is about 38 million years, one hour is 1.6 million years, and one second is about 440 years.
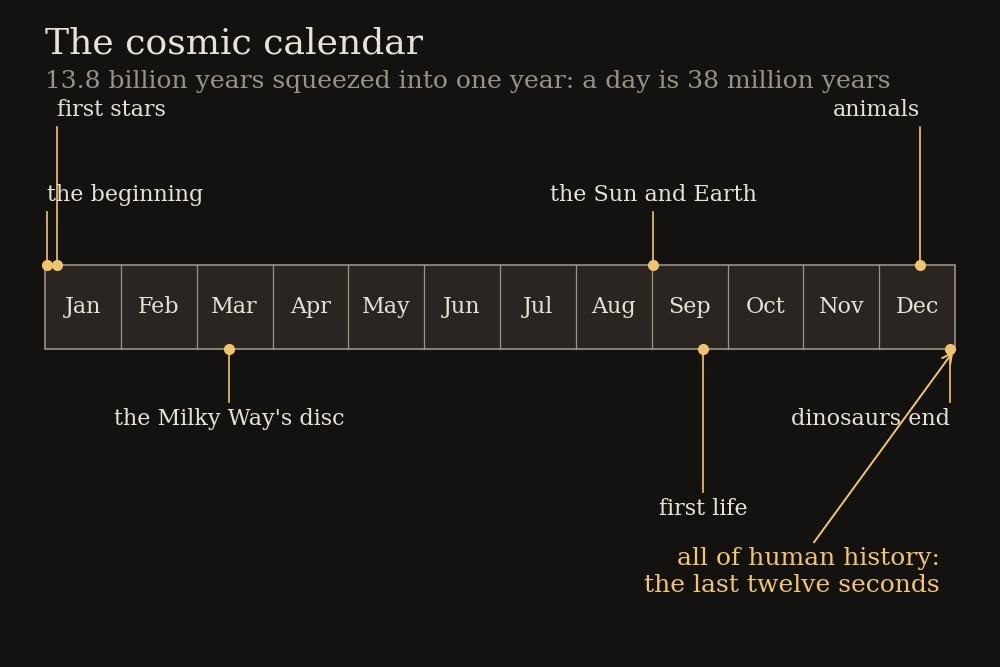
Figure F08-06. The cosmic calendar. Compress 13.8 billion years into one year, and everything humans have ever done fits in the last twelve seconds before midnight on 31 December.
- 1 January, first moments: everything in this chapter up to the making of helium happens in far less than the first second of the first day.
- Early January: the first stars ignite, around 5 January, and the oldest stars in the Milky Way form soon after.
- Mid-March: our galaxy’s disc is taking shape.
- 1 September: the Sun and the solar system form, out of gas already enriched by earlier generations of stars.
- 21 September: the earliest good evidence of life on Earth.
- Late October: oxygen begins to build up in the Earth’s atmosphere.
- 17 December: complex animals appear in the seas.
- 30 December: the asteroid strikes; the dinosaurs go.
- 31 December, 11.40 pm: the first modern humans.
- 31 December, 11.59:48 pm: the passage at Newgrange is built to catch the midwinter Sun.
- 31 December, 11.59:59 pm: the last four hundred years, from Galileo’s telescope to the Webb Space Telescope, occupy the final second.
Everything in Part I of this book, the whole history of humanity noticing and measuring the universe, happens within the last twelve seconds of the year. The universe took its time, and then, very recently and very quickly, part of it worked out where it came from.
Where this leaves us
The account in this chapter is not speculation. Every stage from a trillionth of a second onwards uses physics that has been tested in laboratories, and it makes predictions that have been checked: the proportions of hydrogen and helium, the amount of deuterium, the existence and temperature of the microwave background, the timing of the moment the fog lifted.
But it depends on inputs that this chapter has quietly assumed. The faint ripples that grew into galaxies had to come from somewhere. The clumping had to be helped along by matter we cannot see. The expansion has not proceeded at a steady rate. And the whole account rests on a photograph, taken when the universe was 380,000 years old, that we have so far only glanced at.
The next chapter looks at that photograph properly. It is the richest single source of information in cosmology, and reading it carefully gives the age, the shape and the entire contents of the universe.
Chapter 9 — The Baby Picture
“It is the discovery of the century, if not of all time.” — Stephen Hawking, on the COBE results, 1992
The perfect glow
The hiss that Penzias and Wilson found in 1965 was, for its first quarter-century, a single number: a temperature, the same in every direction, of about 2.7 degrees above absolute zero. That number was enough to kill the steady state. But a single number is not much of a photograph. The transformation of the microwave background from a fact into the richest source of information in cosmology began with a satellite launched in November 1989.
The Cosmic Background Explorer, COBE, had two jobs. The first was to measure the spectrum of the radiation: not just its brightness at one wavelength but the shape of its brightness across all wavelengths. The Big Bang theory made a precise prediction here. Radiation released from a hot, dense, fully mixed universe should have a particular shape of spectrum, called a blackbody spectrum, the same shape given out by any object that is simply hot. If the shape were wrong, the whole story of chapter 8 would be in trouble.
The measurement was presented at a meeting of American astronomers in January 1990, by John Mather, who led the instrument. He showed a graph: the predicted curve, and the measured points laid over it. The points fell so exactly on the curve that the error bars were smaller than the thickness of the line. The audience gave it a standing ovation, which does not often happen to a graph.
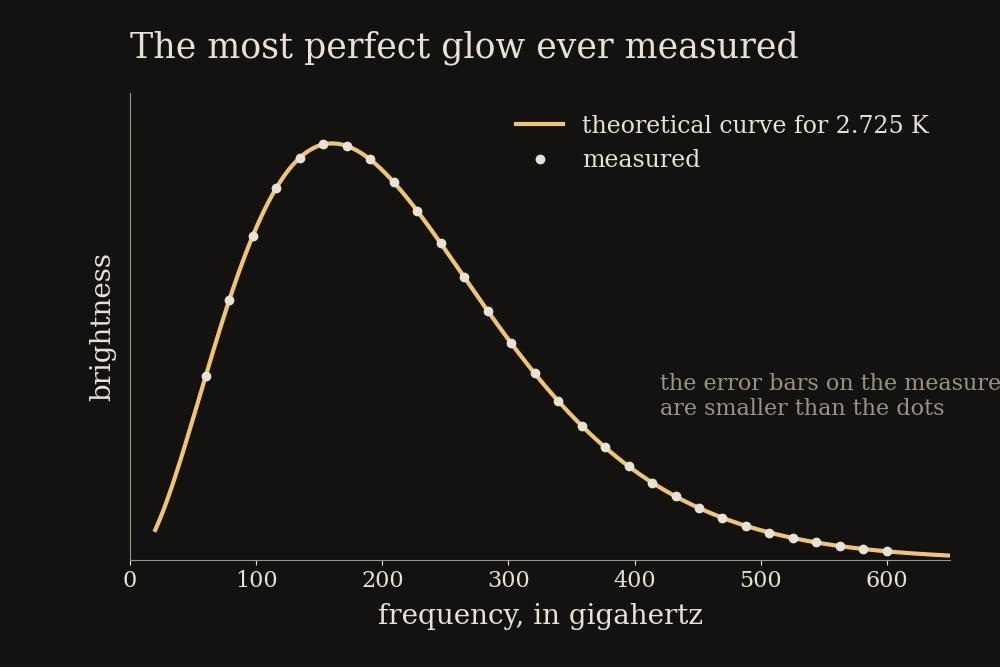
Figure F09-01. The most perfect blackbody spectrum ever measured. The microwave background matches the theoretical curve for a glowing body at 2.725 degrees so precisely that the error bars vanish inside the line.
The microwave background is the most perfect blackbody ever measured, anywhere, by anyone. Nothing made in a laboratory comes close. That is exactly what you would expect if it came from a universe that was once a uniform, opaque, thoroughly mixed furnace, and very hard to explain any other way.
THE EQUATION — Wien’s rule: colour tells temperature
A hot object glows, and the colour of the glow depends only on its temperature: dull red at a few hundred degrees, orange, yellow, white, blue-white as it gets hotter. The rule is simple. The wavelength at which a glowing body is brightest, multiplied by its temperature in degrees above absolute zero, always comes out to the same number, about 2.9 millimetre-degrees.
Try it. The Sun’s surface is about 5,800 degrees, so its brightest wavelength is 2.9 divided by 5,800 millimetres, which is 0.0005 millimetres, or 500 nanometres: yellow-green, the middle of the visible band, which is no coincidence, since our eyes evolved under it. An electric hotplate at 800 degrees above absolute zero peaks at about 3.6 thousandths of a millimetre, in the infrared, which is why you feel its heat before you see it glow. Your own body, at 310 degrees above absolute zero, peaks at about nine thousandths of a millimetre: you shine in the far infrared, which is what thermal cameras see.
And the microwave background, at 2.725 degrees, peaks at 2.9 divided by 2.725, which is just over one millimetre. That is why a glow that started out orange-white is now found by radio telescopes.
Ripples in the fog
COBE’s second job was harder. If the radiation were perfectly uniform in every direction, the universe at 380,000 years would have been perfectly smooth. But it cannot have been, because a perfectly smooth universe stays smooth: gravity needs something slightly denser than average to get a grip on. For galaxies to exist today, the early universe must have had faint lumps, and those lumps should show up as very slightly hotter and cooler patches in the microwave sky.
The catch was how faint. Given that galaxies exist, and given how long gravity has had to work, the patches needed to be there at a level of about one part in a hundred thousand: a difference of a few hundred-thousandths of a degree on a background of 2.7 degrees. Nobody had ever measured anything so evenly spread so precisely.
Two complications had to be dealt with first. The Earth is moving through the radiation, at about 370 kilometres per second, carried along by the Sun’s orbit around the galaxy and the galaxy’s own drift. That motion makes the sky very slightly hotter in the direction we are heading and cooler behind, by about one part in a thousand, a hundred times larger than the effect being hunted. It has to be measured and subtracted. And the Milky Way itself glows at microwave wavelengths, a bright band across the middle of the sky that has to be modelled and removed.
After two years of data and painstaking analysis, George Smoot’s team announced in April 1992 that the patches were there. Blotchy irregular regions, a few degrees across, warmer or cooler than average by about thirty millionths of a degree. The map was crude, the blobs enormous and blurred, but the ripples were real. Those faint blotches were the seeds of every galaxy cluster in the universe.
The reaction was the strongest since the eclipse of 1919. Hawking’s remark opened this chapter; Smoot himself, at the press conference, compared the sight to seeing the face of God, a phrase that followed him for the rest of his career and which he came to regret. Mather and Smoot shared the Nobel Prize in 2006.
Sharper pictures
COBE’s map had a resolution of about seven degrees, fourteen times the width of the full Moon. It could see the lumps but not their shape. The next two decades were spent sharpening the picture.
Balloon-borne telescopes carried above most of the atmosphere from Antarctica and Texas produced the first detailed maps of small patches of sky around 2000. Then came two more satellites. The Wilkinson Microwave Anisotropy Probe, WMAP, launched in 2001 and mapped the whole sky at a resolution of about a quarter of a degree for nine years. The European Planck satellite, launched in 2009, did the same with three times finer resolution and greater sensitivity, and released its final analysis in 2018. These are the maps reproduced in every modern textbook.
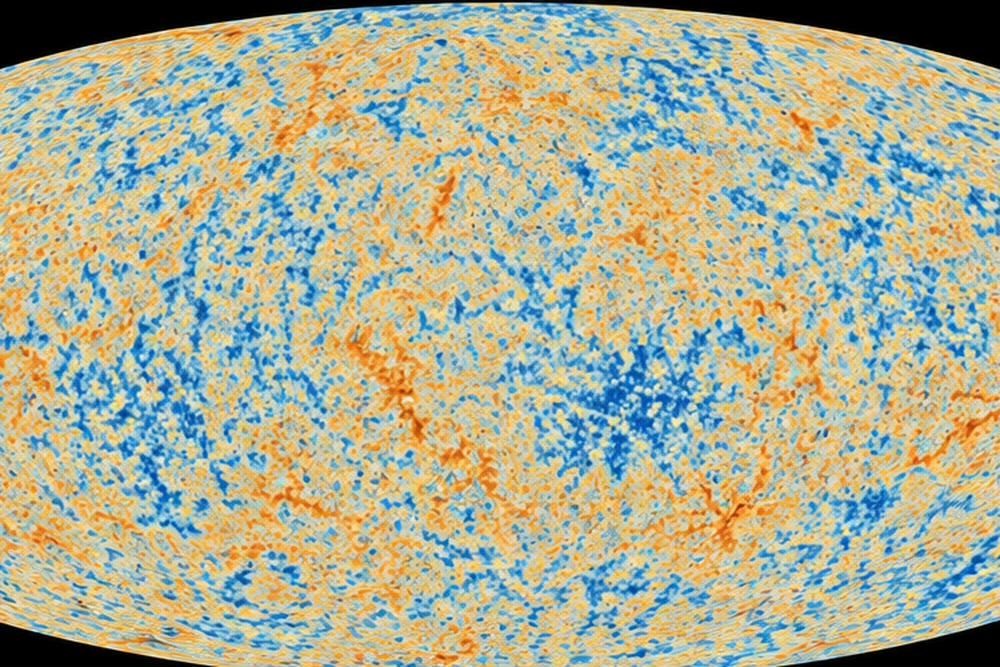
Figure F09-02. The whole sky in microwaves. Every blotch is a region of the universe at 380,000 years that was very slightly hotter or cooler than average; their sizes and pattern encode the universe’s age, shape and contents.
The oval map is worth a moment’s thought, because it is genuinely strange. It is a picture of the entire sky, projected flat the way an atlas projects the globe, showing light that set out from all directions when the universe was less than three per cent of its present age. It is, as nearly as anything can be, a photograph of the young universe, and in one sense it is the oldest photograph possible, because before that moment the universe was opaque.
What the sharper maps revealed was that the blotches are not random. They have a characteristic size. Patches about one degree across, twice the width of the full Moon, are far more common than any other size, with smaller and larger ones falling off in a specific pattern. Something had set a preferred scale in the early universe, and working out what turned the map from a picture into a measurement.
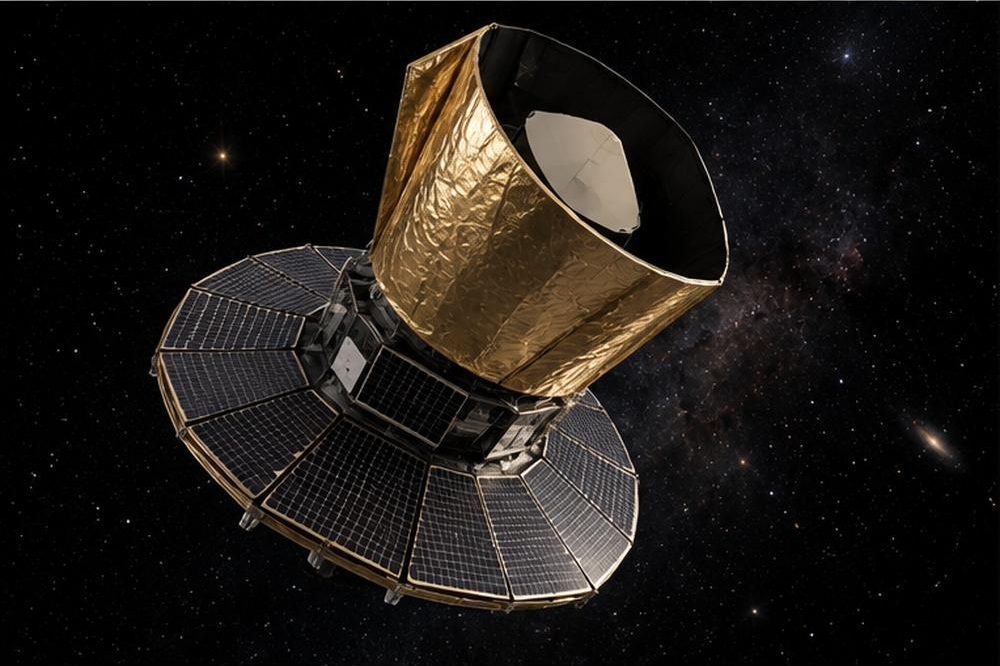
Figure F09-03. The Planck satellite. Operating from a spot one and a half million kilometres from Earth, it mapped the microwave sky with detectors cooled to a tenth of a degree above absolute zero.
Sound waves in the young universe
The preferred scale is the echo of sound.
Before the fog lifted, the early universe was a tightly coupled mixture: radiation and ordinary matter locked together, because the radiation kept bouncing off the free electrons and the electrons dragged the nuclei with them. That mixture behaved as a single fluid, and it had a pressure, supplied by the radiation. Where the fluid was slightly denser than average, gravity pulled it inward. As it compressed, the radiation pressure rose and pushed it back out. It overshot, thinned, fell back, and overshot again.
In other words, the early universe rang. Every over-dense patch was a source of sound waves, spreading outwards through the fluid at a little over half the speed of light, which is how fast sound travels in a medium that is mostly radiation.
These waves had been travelling since almost the beginning. When recombination arrived at 380,000 years and the fog lifted, the fluid ceased to be a fluid; the radiation flew off, and the sound waves stopped dead, frozen in place. The most prominent frozen feature was the distance a sound wave had travelled in 380,000 years, which is a well-defined length, about 450,000 light-years at the time.
So the microwave background should be covered in patches of that particular size: ripples whose width is the distance sound had travelled. And it is. The one-degree patches are the sound horizon, seen from 13.8 billion years away. The smaller preferred sizes, at fractions of a degree, are the overtones, from regions that had bounced twice or three times by the time the music stopped.
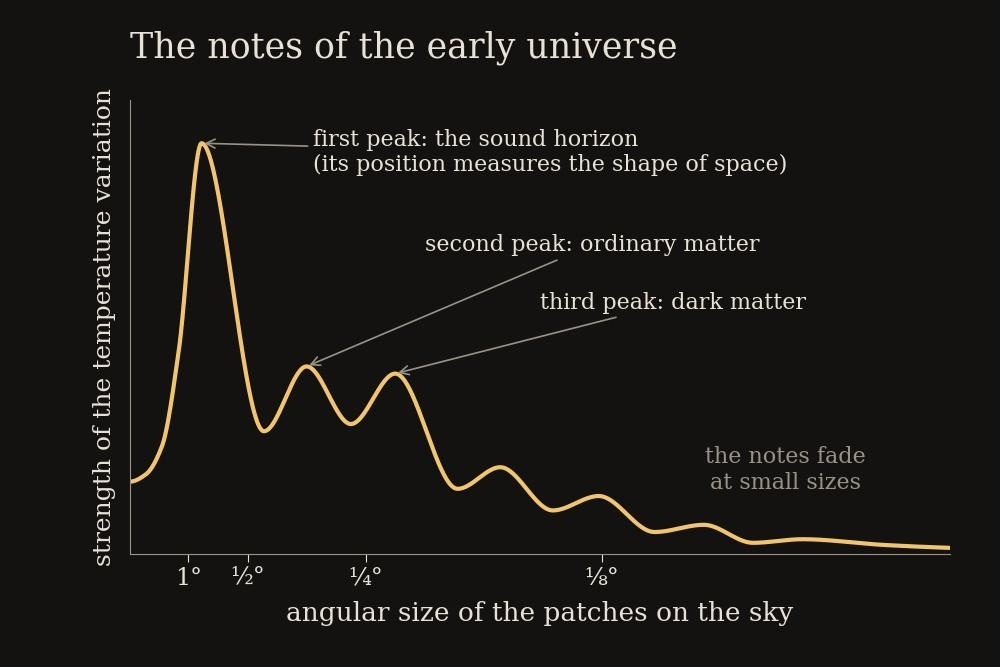
Figure F09-04. The notes of the early universe. Plotting how strongly the sky varies at each angular size gives a series of peaks, like the overtones of a musical instrument. Their positions and heights are the measurement.
KEY CONCEPT — Reading the peaks
Cosmologists turn the map into a graph by asking, for each possible patch size, how strongly the sky varies at that size. The result is a curve with a series of peaks, shown above, and it is read the way a musician reads the overtones of a note.
The position of the first peak, the angular size of the most common patches, depends on the geometry of space between us and the wall of fire. That is the shape measurement in the next section.
The height of the second peak relative to the first depends on how much ordinary matter there was: more matter makes the fluid heavier, so it compresses further than it rebounds, boosting the odd peaks over the even ones.
The height of the third peak depends on how much dark matter there was, because dark matter feels gravity but not radiation pressure, and so deepens the wells without taking part in the bouncing.
The fading of the peaks at small sizes depends on how long recombination took and how far the radiation could leak across the ripples in that time.
Six numbers describing the universe are enough to fit every wiggle of this curve, from the largest scales to the smallest, with astonishing precision. That is the sense in which the microwave background is a measurement of the whole universe: the tune it plays has been read, and there is only one instrument that plays it.
Measuring the shape of space
Chapter 6 explained that mass curves spacetime. It follows that the universe as a whole can be curved, and Einstein’s equations allow three possibilities, decided by how much stuff the universe contains compared with its expansion rate.
If there is more than a certain critical amount, space curves back on itself like the surface of a sphere: finite in size, without an edge, and destined to stop expanding and collapse. If there is less, it curves the other way, like a saddle, and is infinite and expands forever. If there is exactly the critical amount, space is flat, in the sense that ordinary school geometry works on the largest scales, and it also expands forever, ever more slowly.
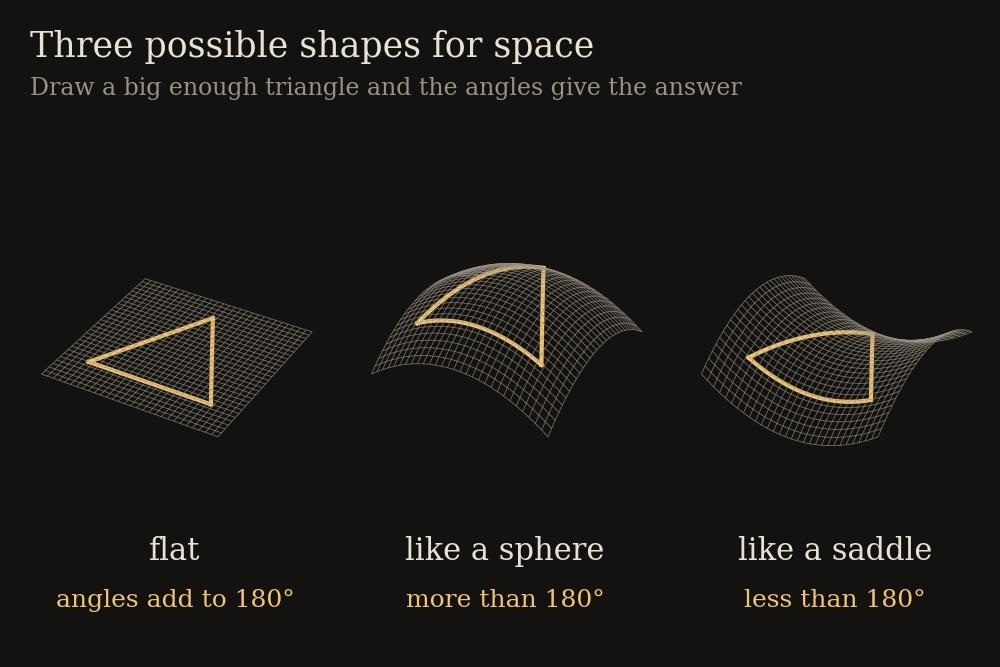
Figure F09-05. Three possible shapes for space. On a sphere the angles of a triangle add up to more than 180 degrees; on a saddle, less; on a flat surface, exactly 180. The microwave background is a triangle big enough to test.
The classic test is to draw a very large triangle and add up its angles. On a flat surface they sum to 180 degrees. On a sphere they add up to more, which you can check on a globe by drawing a triangle from the north pole down to the equator, along the equator a quarter of the way round, and back up: three right angles, 270 degrees. On a saddle they add up to less.
The microwave background provides the triangle. Two of its corners are the ends of a ruler of known length, the sound horizon, lying on the wall of fire; the third corner is us. Knowing how long the ruler is and how far away it is, you can calculate how big it should look if space is flat. Then you measure it. If it looks bigger than calculated, space is curved like a sphere, because the light rays from its two ends have converged on the way. If it looks smaller, space is saddle-shaped.
The first peak sits at almost exactly the angle that flat space predicts. The universe, to within a fraction of a per cent, is flat.
This was a surprise, and it was also a problem. Flat means the universe contains exactly the critical amount of matter and energy. But adding up all the ordinary matter that can be seen or inferred, in stars, gas and dust, gives only about five per cent of the critical amount. Even adding the invisible matter of the next chapter takes the total to only about a third. Two-thirds of the universe was unaccounted for, and the microwave background was demanding that it be there. Chapter 11 supplies it.
The recipe
Put everything together, and the microwave background hands over a table of numbers about the universe, each with a small uncertainty. The final analysis from Planck in 2018 gave the following.
- The universe is 13.8 billion years old, give or take about 20 million years, which is an uncertainty of about a sixth of one per cent.
- Space is flat, to within about half a per cent.
- Ordinary matter, everything made of atoms, is 4.9 per cent of the total content.
- Dark matter, the invisible kind, is 26.5 per cent.
- Dark energy, the subject of chapter 11, is 68.5 per cent.
- The fog lifted 380,000 years after the beginning.
- The expansion rate today is about 67 kilometres per second per megaparsec, a value that is now the subject of a lively argument, described in chapter 13.
Two of these numbers deserve a pause, because they were confirmed by completely independent means. The 4.9 per cent of ordinary matter is the same answer that the light-element cooking in chapter 8 gives, from measuring deuterium in ancient gas: two entirely different pieces of physics, one at three minutes and one at 380,000 years, giving the same figure. And the flatness, a geometric measurement, matches the total obtained by adding up the three ingredients, which were each measured by their separate effects. When independent measurements agree like this, it is hard to believe the whole framework is wrong.
There is a sobering way of reading the recipe. Everything astronomy studied for its first five thousand years, from the light in the passage at Newgrange to the galaxies in Hubble’s photographs, lives in the 4.9 per cent. The remaining 95 per cent is two kinds of something whose nature we do not know.
A backlight for the universe
The microwave background is not only a picture of the early universe. Because it comes from behind everything else, it is also a backlight, and everything between the wall of fire and us leaves a faint shadow or distortion on it.
Two of these are now used routinely. When the microwaves pass through the hot gas of a galaxy cluster, a few of them are bumped to slightly higher energy by collisions with fast electrons, leaving a small characteristic dent in the spectrum at the cluster’s position. Thousands of clusters have been found this way, some so distant that they are hard to see by any other means, and the effect does not fade with distance, which makes it an unusually fair way of counting clusters across cosmic history.
More subtly, the gravity of all the matter along the line of sight, visible and invisible, slightly bends the microwaves on their way to us, the same light-bending that Eddington measured in 1919. The result is that the pattern of blotches is very slightly warped, as if seen through old, uneven window glass. Measuring the warping maps the total mass between us and the wall of fire, and the map agrees with the amount of dark matter inferred by other means. Chapter 10 has more on this trick, which has become one of the main ways of seeing the invisible.
The oddities
A chapter that presented the microwave background as a triumph without mentioning its puzzles would be giving a false impression, so here are the main ones.
On the very largest scales, spanning a good fraction of the sky, the pattern is slightly weaker than the standard theory predicts, and its largest features seem faintly aligned with one another and with the plane of the solar system, an arrangement that was nicknamed the axis of evil. There is also an unusually large, unusually cold patch in the southern sky, called the Cold Spot. Each of these has been argued over for twenty years.
The cautious view, which is also the majority view, is that they are probably nothing. On the largest scales there are only a handful of independent patches to measure, so chance alone can produce apparent patterns, in the same way that a dozen coin tosses can look lopsided. And some of the alignments have weakened as the data improved and as the modelling of the Milky Way’s foreground glow got better. But they have not entirely gone away, and a minority of cosmologists suspect they are telling us something about physics at the largest scales, or about the very early universe. They are honest loose threads, and chapter 14 mentions where things stand.
The ground game
Satellites are not the only way to see the microwave sky, and the sharpest recent results have come from the ground, in the two driest places on Earth.
Microwaves at the relevant wavelengths are absorbed by water vapour, so the telescopes are sited where there is almost none: the high Atacama desert of northern Chile, above five thousand metres, and the South Pole, where the air is thin, cold and bone-dry, and where a telescope can stare at the same patch of sky for the entire six-month polar night.
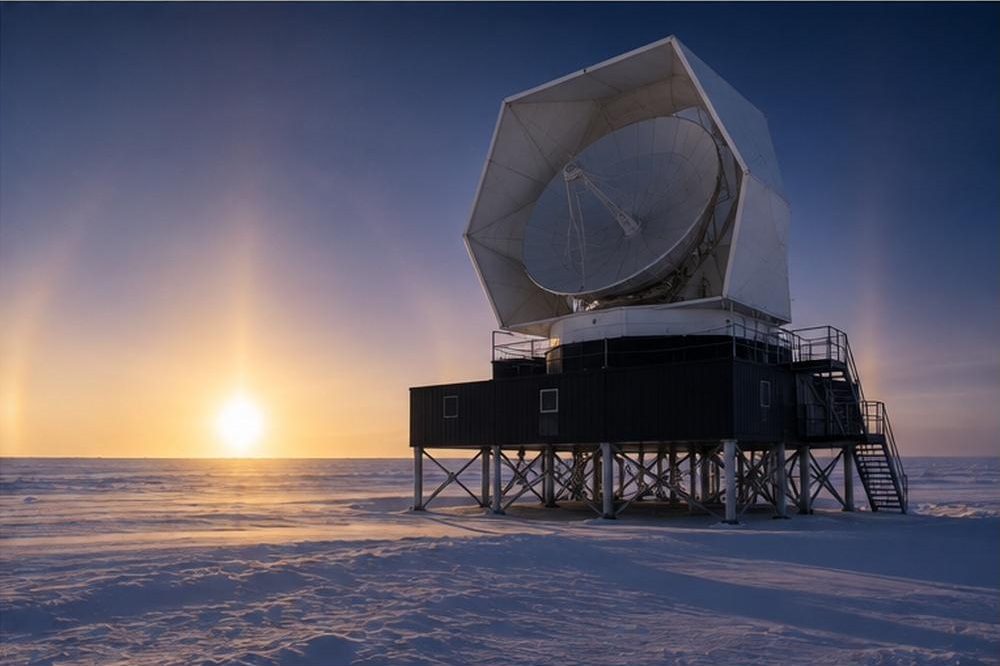
Figure F09-06. A telescope at the South Pole. The dry, stable polar air is the best on Earth for microwave astronomy, and a telescope there can track a single patch of sky through the long polar night.
These telescopes cannot see the whole sky as Planck did, but they can see small patches in far finer detail, and they measure something Planck could only glimpse: the polarisation of the microwave background, a subtle preferred orientation in the waves imprinted as they last scattered off the electrons of the fog. Polarisation carries independent information about the same sound waves, and it is also the place to hunt for the signature of gravitational waves from inflation, which chapter 12 describes. A new generation of instruments in Chile, collectively called the Simons Observatory, began taking data in 2024 and is the current state of the art.
Where this leaves us
The microwave background has done something no other observation can. It has weighed the universe, dated it, measured its shape and listed its contents, all from a single sheet of light released before any star existed, and each of its answers has been cross-checked against something independent.
But the list of contents is deeply unsatisfying. Ordinary matter, the only kind anyone has ever handled, is a twentieth of the total. A quarter of the universe is matter of a kind that does not shine, absorb or reflect light, and whose only known property is that it has gravity. Over two-thirds is something stranger still, an energy that appears to belong to space itself and pushes the expansion faster. The next two chapters take these in turn, beginning with the invisible matter, whose story starts not with satellites but with a Swiss astronomer in 1933 who noticed that a cluster of galaxies should have flown apart long ago.
Chapter 10 — The Invisible Majority
“Dark matter is present in much greater amount than luminous matter.” — Fritz Zwicky, 1933
The cluster that should fly apart
Fritz Zwicky was a Swiss astronomer at Caltech, a man of ferocious originality and a temper to match, who coined the term supernova, predicted neutron stars two years after the neutron was discovered, and referred to colleagues he disliked as spherical bastards, on the grounds that they were bastards whichever way you looked at them. He was also, in 1933, the first person to notice that most of the universe is missing.
He was studying the Coma cluster, a swarm of about a thousand galaxies some three hundred million light-years away, and he did something simple. He measured how fast the galaxies were moving, using the Doppler method of chapter 4, and he estimated how much the cluster weighed, by adding up the light of its galaxies and assuming they contained a reasonable number of stars for their brightness.
The two numbers did not agree. The galaxies were moving far too fast. A cluster held together only by the gravity of its visible stars could not possibly hold on to galaxies moving at those speeds; they would have scattered into space long ago, and the cluster would not exist. For the cluster to be stable, it needed to contain something like a hundred times more mass than could be seen. Zwicky concluded that the cluster was full of what he called, in German, dunkle Materie: dark matter.
Almost nobody paid attention for forty years. Zwicky’s estimate was rough, the distance scale of the time was badly wrong, which exaggerated his numbers, and the claim was strange. It sat in the literature like Alpher and Herman’s prediction of the microwave background, waiting.
THE EQUATION — Orbital speed reveals mass
This is Cavendish’s method from chapter 3, and it is the only way anything in astronomy is ever weighed. If something is in orbit, the speed of the orbit and its size together give the mass inside it. The rule is: mass equals the orbital speed multiplied by itself, then multiplied by the size of the orbit, then divided by Newton’s gravitational constant. In symbols, M = v²r ÷ G.
Take the Sun, orbiting the centre of the Milky Way at about 230 kilometres per second at a distance of about 26,000 light-years. Put those numbers in, with the known value of G, and out comes the mass inside the Sun’s orbit: about a hundred billion times the mass of the Sun.
That figure is fine on its own. The trouble starts when you do the same sum for stars further out.
The galaxy that spins too fast
The astronomer who made dark matter impossible to ignore was Vera Rubin. She had wanted to be an astronomer since childhood, was told by Princeton that they did not admit women to graduate astronomy, went to Cornell and Georgetown instead, and spent a career choosing problems that other people were not fighting over, in her words, so that she could work in peace.
In the late 1960s and 1970s, with the instrument-builder Kent Ford, she measured how fast stars and gas clouds orbit within spiral galaxies, starting with Andromeda and moving on to dozens of others. Ford’s spectrograph could record a galaxy’s spectrum at many points along its disc in a single exposure, so that Rubin could read off the orbital speed at each distance from the centre. Plot speed against distance and you have what is called a rotation curve.
Everyone knew what it should look like. Newton’s law, applied to a galaxy whose mass is where its light is, concentrated in the bright central bulge, says that stars far from the centre should orbit slowly, just as Neptune orbits the Sun far more slowly than Mercury. The curve should rise steeply near the centre and then fall away towards the edge.
It did not fall. In galaxy after galaxy, the speed rose and then stayed flat, all the way to the outermost gas clouds Rubin could measure, far beyond the visible edge of the disc. Stars at the edge were orbiting as fast as stars halfway in.
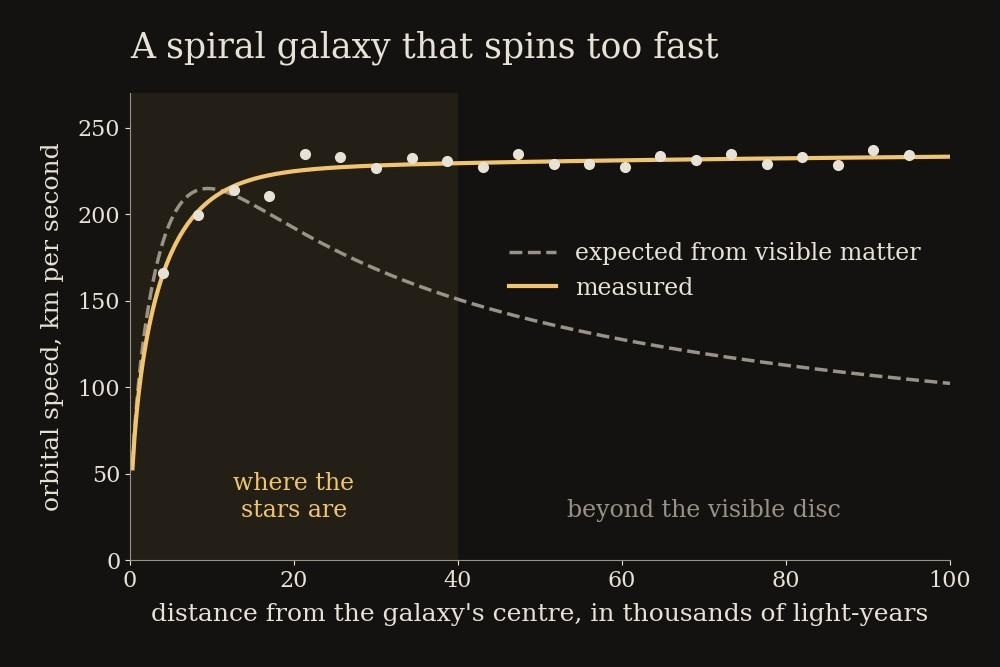
Figure F10-01. A galaxy’s rotation curve. Visible matter alone predicts the falling line; the measured speeds stay flat far beyond the edge of the starlight. Something unseen is supplying the extra pull.
The equation box says what that means. If the speed stays constant as the distance doubles, the mass inside the orbit must double too. So the mass of a galaxy keeps growing outwards, long past the point where the stars have run out. Every spiral galaxy is embedded in an enormous, roughly spherical halo of invisible matter, extending far beyond the stars and outweighing them several times over. The bright disc we photograph is the froth on something much larger and darker.
Rubin’s data, published from 1978 onwards, were clean, reproducible and impossible to argue away. Around the same time, the theorists Jeremiah Ostriker and Jim Peebles found that a spinning disc of stars on its own is unstable and would twist itself into a bar within a few rotations, and that a massive surrounding halo was needed to keep spiral galaxies looking as they do. By 1980 most astronomers accepted that galaxies contain a great deal of matter that does not shine. The question was what it was.
Light bent by the unseen
The rotation curves were hard to dispute, but they were all measured the same way. What convinced the doubters was seeing the missing mass by a completely different method, one that comes straight from chapter 6.
Mass bends light. Eddington had measured the Sun doing it in 1919. A galaxy or a cluster of galaxies, being vastly more massive than the Sun, should bend the light from anything behind it far more, acting as a lens made of gravity. Einstein calculated the effect for a star in 1936 and dismissed it as unobservable, since the alignment needed would be absurdly rare. He had not considered galaxies.
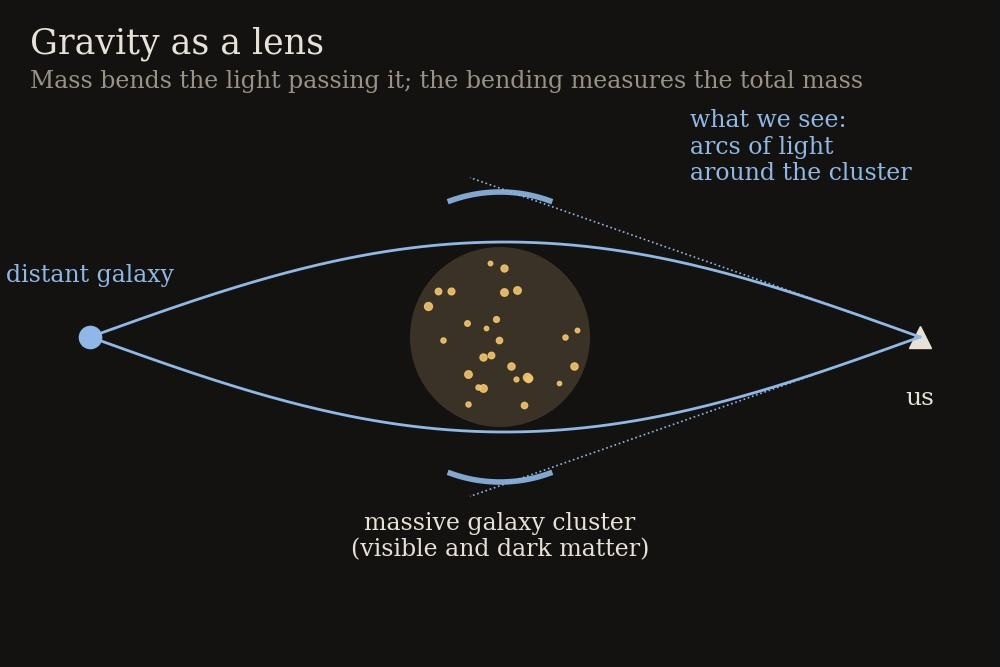
Figure F10-02. Gravitational lensing. Light from a distant galaxy is bent by the mass of a nearer cluster, so the distant galaxy appears smeared into arcs. The shapes of the arcs measure the total mass doing the bending, visible or not.
The first gravitational lens was found in 1979, a quasar appearing as two identical images a few seconds of arc apart, split by a galaxy in between. In the late 1980s astronomers found something stranger: long, thin, curved streaks of light around the centres of rich galaxy clusters, which turned out to be the images of galaxies far behind the cluster, stretched into arcs by its gravity. The cluster was acting as a lens, and a badly made one, smearing the background galaxies into distorted crescents.
The crucial point is that the amount of bending depends on the total mass of the cluster, and on nothing else. It does not matter whether the mass shines. Work backwards from the shapes of the arcs to the mass required to produce them, and you get the same answer Zwicky got by a completely different route: clusters weigh far more than their visible galaxies and gas, by a factor of five or six.
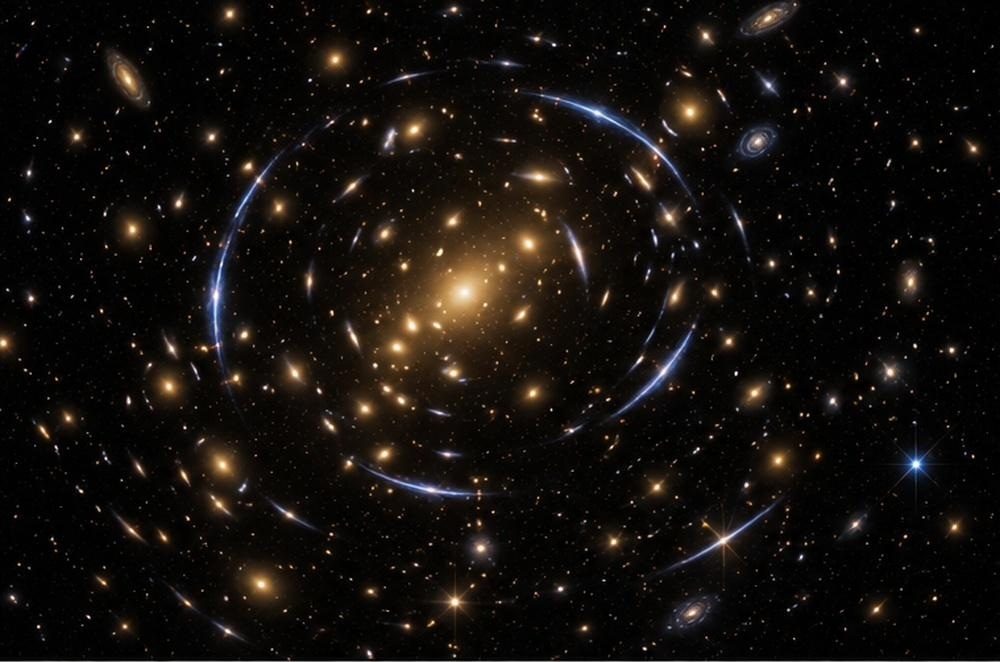
Figure F10-03. Arcs around a galaxy cluster. Each blue streak is a galaxy far beyond the cluster, its image stretched by the cluster’s gravity. The amount of stretching weighs the cluster.
Lensing has since become the workhorse of dark-matter mapping. Where the alignment is not good enough to make arcs, the gravity of foreground matter still distorts the shapes of background galaxies slightly, stretching them by a per cent or so in a preferred direction. No single galaxy shows it, since galaxies come in all shapes anyway, but measure the shapes of millions and the average stretching maps the mass along the way. This is called weak lensing, and it can map dark matter in places where there is nothing visible at all. The Euclid satellite, launched in 2023, was built to do this across a third of the sky.
The Bullet Cluster
One image is usually credited with ending the argument about whether dark matter is real matter rather than a misunderstanding of gravity. It is a picture of two clusters of galaxies that crashed into each other a hundred and fifty million years ago, and it is a natural experiment on a scale of millions of light-years.
A galaxy cluster is not mostly galaxies. Most of its ordinary matter, by a factor of about five, is hot, thin gas spread between the galaxies, glowing in X-rays at tens of millions of degrees. When two clusters collide, the galaxies, being small and far apart, sail straight through one another almost untouched. The gas does not. The two gas clouds slam together, slow down, and pile up between the two groups of galaxies, like two crowds passing through each other while the cloud of dust they kick up stays in the middle.
So after the collision, the ordinary matter is mostly in the middle, in the hot gas, and the galaxies are off to either side. Now the question: where is the mass? If dark matter is real material that barely interacts with anything, it should have passed straight through like the galaxies, and the lensing should show most of the mass out at the sides, where the galaxies are and the gas is not. If there is no dark matter, and the extra gravity comes instead from some modified law acting on the ordinary matter, the lensing should show the mass concentrated where the gas is, in the middle.
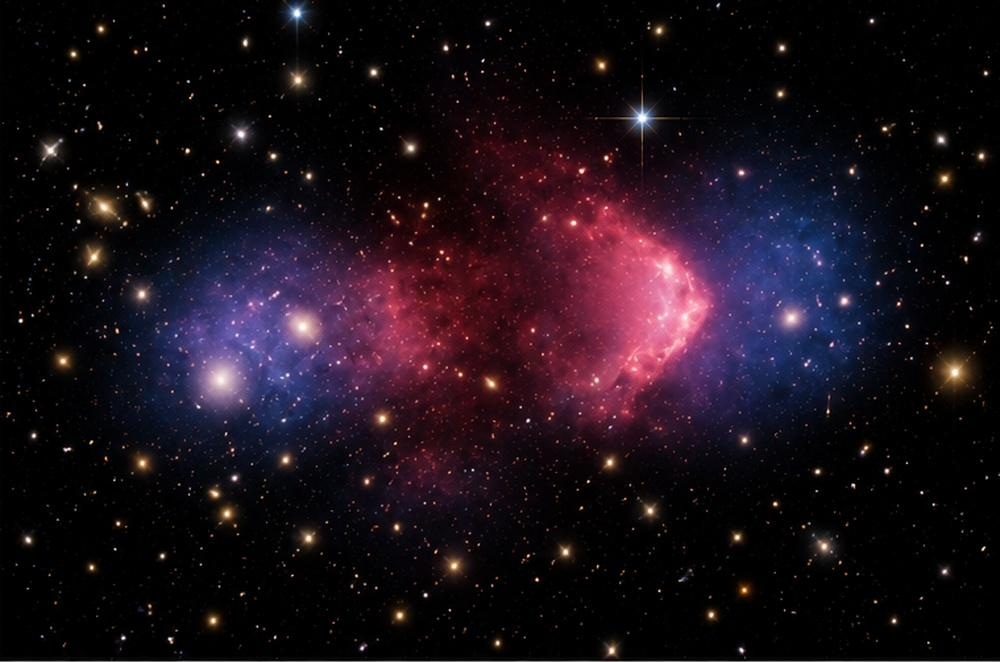
Figure F10-04. The Bullet Cluster. The hot gas, most of the ordinary matter, was left behind in the middle of the collision; the mass, mapped by lensing, went straight through with the galaxies. Dark matter behaves like matter.
The lensing map, published in 2006, showed the mass at the sides. The dark matter had passed through the collision, ignoring the gas and ignoring itself, exactly as invisible, almost non-interacting matter should. This is also about the strongest available evidence that dark matter interacts with itself very weakly, because if it did not, the two dark halos would have collided and stalled like the gas.
Scaffolding for galaxies
By this point dark matter had been seen, indirectly, at every scale from single galaxies to clusters. The final piece of evidence is that without it, galaxies could not exist at all.
Chapter 9 explained that the microwave background carries the seeds of structure: ripples in density of about one part in a hundred thousand. Chapter 8 explained that gravity makes such ripples grow. The question is whether they could have grown fast enough. The universe is 13.8 billion years old, the ripples were tiny, and gravity working on ordinary matter alone is slow, partly because ordinary matter could not start clumping until the fog lifted, since before that the radiation pressure kept it stirred.
Run the calculation with ordinary matter only and the galaxies do not form in time. The universe today would still be a nearly smooth gas.
Dark matter fixes this because it does not feel radiation. It could start clumping long before the fog lifted, while the ordinary matter was still locked to the light, and by 380,000 years it had already built a faint invisible framework of denser and less dense regions. When the ordinary matter was released, it simply fell into the wells that dark matter had already dug. The head start is what makes galaxies possible, and it is why the third peak of the microwave background, described in chapter 9, has the height it does.
Computer simulations following billions of dark-matter particles under gravity from the microwave-background ripples to the present produce a universe that looks like ours: galaxies strung along filaments, filaments meeting at dense clusters, enormous empty voids between them. The same simulations without dark matter produce nothing of the kind.
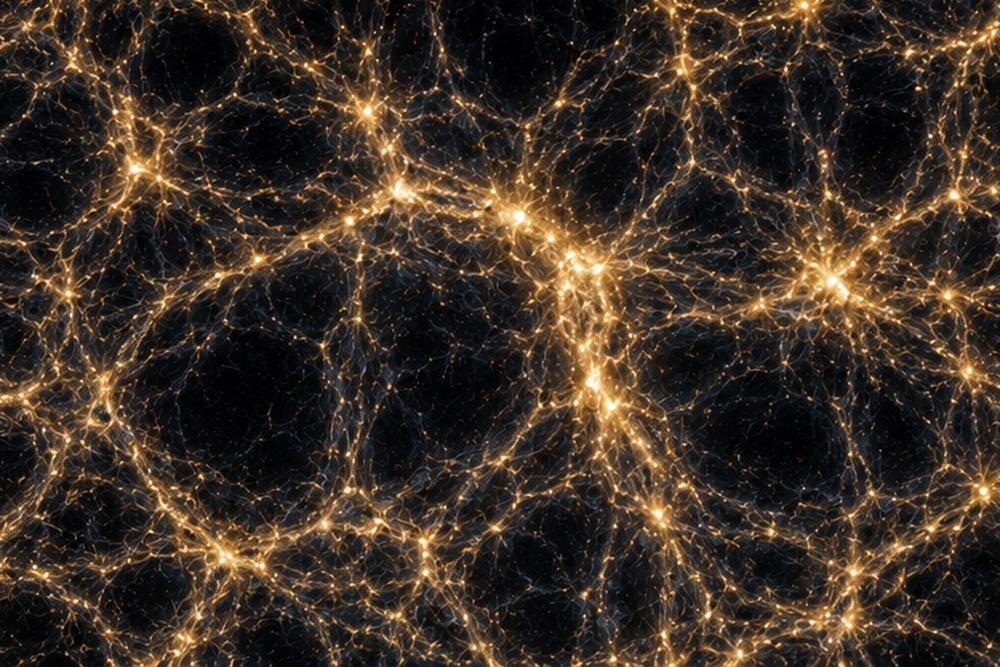
Figure F10-05. The cosmic web in a simulation. Dark matter, following gravity alone from the ripples in the early universe, builds the scaffolding of filaments and knots along which galaxies form.
KEY CONCEPT — Why it is not just dim ordinary matter
The obvious guess is that dark matter is ordinary stuff that happens not to shine: dead stars, rogue planets, cold gas, black holes. Every one of these has been checked and ruled out as the main answer.
The first check is the light-element cooking of chapter 8. The amount of deuterium left over fixes how much ordinary matter there is, of any kind, shining or not, and the answer is about five per cent of the total. Dark matter is five times that. There is simply not enough ordinary matter in the universe to be it.
The second check is the microwave background, which gives the same five per cent by an independent method, and whose peaks would look quite different if the extra matter felt radiation pressure, as all ordinary matter does.
The third is direct. Compact dark objects such as dead stars would occasionally pass in front of background stars and briefly brighten them by lensing. Surveys watched millions of stars for years and found far too few such events. Whatever the dark matter is, it is not made of atoms. The companion volume goes into the particle physics; here the point is that it is a new kind of substance.
The suspects
If it is not atoms, what is it? Nobody knows, but there are three leading candidates, each with its own kind of experiment.
The first is a heavy, slow-moving particle that interacts only through gravity and the weak nuclear force. Such a particle, if it existed and had roughly the mass of a large atom, would have been produced in the early universe in almost exactly the amount needed: this coincidence is sometimes called the WIMP miracle, WIMP being short for weakly interacting massive particle. For thirty years it was the favourite.
The second is the axion, a particle originally proposed in the 1970s to fix an unrelated puzzle about the strong nuclear force, which would be extraordinarily light, far lighter than an electron, but produced in such stupendous numbers that it could still make up the missing mass. Axions would behave less like a swarm of particles and more like a vast slow wave filling the galaxy.
The third is black holes formed in the first fraction of a second, before any star existed, from the collapse of unusually dense patches of the early universe. This idea had gone out of fashion, and was revived when gravitational-wave detectors began finding black holes of unexpected sizes, described in chapter 17. Most of the possible range of masses has since been ruled out, but a window remains.
There are others: heavier cousins of the neutrino, whole hidden families of particles with their own forces, and more. The honest summary is that the candidates are plentiful and the evidence to choose between them is, so far, absent.
Under the mountain
The most direct approach is to catch one. If dark-matter particles fill the galaxy, then billions are passing through your body every second, and very occasionally one should collide with an atomic nucleus and give it a tiny kick.
The detectors built to see this kick are among the strangest instruments in science. The current generation consists of tanks holding several tonnes of liquid xenon, cooled to about a hundred degrees below zero, watched by hundreds of light sensors. A nucleus struck by a passing particle recoils and produces a faint flash of light and a few freed electrons, which the sensors record. The expected rate is perhaps a handful of events a year, in a detector where cosmic rays and natural radioactivity would produce millions.
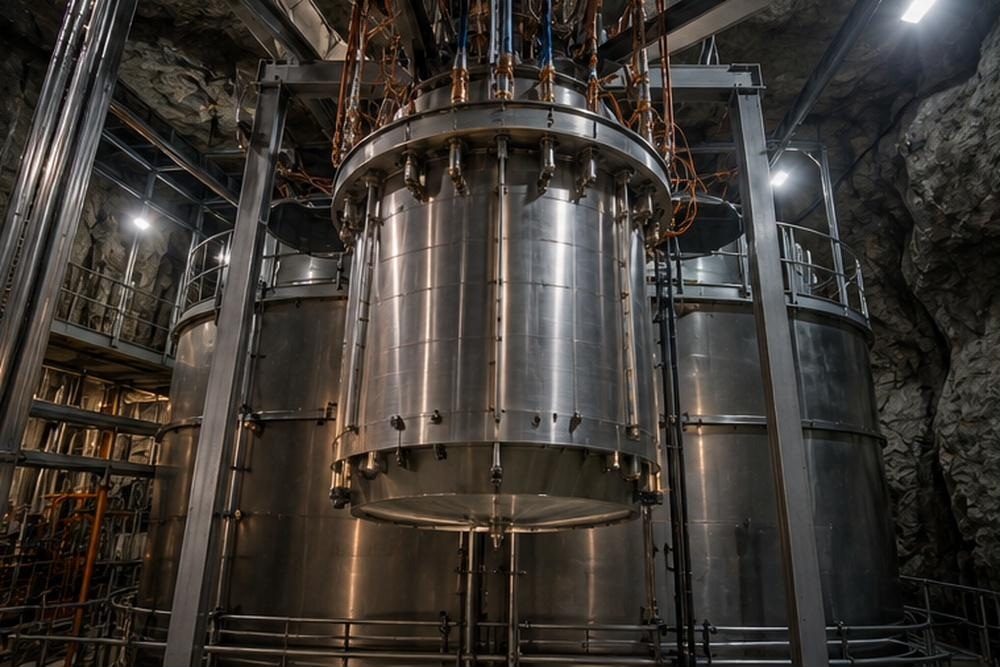
Figure F10-06. A dark-matter detector deep underground. A tank of liquid xenon, shielded by a kilometre of rock, water and lead, waits for a single nucleus to be nudged by a passing invisible particle.
So the detectors are buried. The LUX-ZEPLIN experiment sits in a former gold mine in South Dakota, a kilometre and a half down. XENONnT is under the Gran Sasso mountain in Italy, PandaX under two and a half kilometres of rock in China. The rock stops cosmic rays; the xenon itself is purified to remove almost every trace of radioactive contamination; the tank sits inside a tank of water inside a tank of shielding. What remains is one of the quietest places in the universe.
They have found nothing. Each generation of detector has been more sensitive than the last, and each has reported a null result, ruling out a larger and larger range of possible WIMP masses and interaction strengths. Results from LUX-ZEPLIN and XENONnT through 2024 and 2025 have pushed the limits to the point where the detectors are approaching a floor set by neutrinos from the Sun and from distant supernovae, which produce kicks that look almost identical to the hoped-for signal. Below that floor the search becomes far harder.
Axion detectors work differently, using strong magnetic fields to coax the passing wave of axions into producing faint radio signals, and are tuning slowly through the possible range like a radio searching for a station. They too have found nothing yet, but have covered only a small fraction of the dial. The Large Hadron Collider has looked for dark-matter particles being produced in collisions, and has seen none.
Thirty years ago the WIMP was expected to turn up within a decade. It has not, and some physicists have started to say so out loud. The field is uncomfortably aware that it may have been searching in the wrong place, while also being unable to say where the right place is.
Or is gravity wrong?
There is an alternative, and honesty requires taking it seriously. Every piece of evidence for dark matter is really evidence that gravity, as calculated from visible matter, is too weak to explain what we see. The standard response is to add invisible matter. The other response is to change the law of gravity.
In 1983 the Israeli physicist Mordehai Milgrom proposed exactly this. His idea, called Modified Newtonian Dynamics, or MOND, keeps Newton’s law wherever gravity is strong, which includes the whole solar system, and alters it only where the gravitational pull is extraordinarily feeble, as it is in the outskirts of galaxies. With a single adjustment, MOND reproduces the flat rotation curves of spiral galaxies remarkably well, and it predicted in advance a tight relation between a galaxy’s total light and its rotation speed that observations have since confirmed and that dark-matter models have to work harder to explain.
Those are real successes, and they are why MOND retains a small band of serious defenders. But it has serious difficulties, and they grow as the scale grows. It reduces but does not remove the missing mass in galaxy clusters, which still need extra matter. It has no natural account of the Bullet Cluster, where the mass is plainly not where the ordinary matter is. It has struggled to reproduce the pattern of peaks in the microwave background, which the dark-matter picture fits in detail. And it is not a complete theory: it is a modification of Newton’s gravity, which is only an approximation, and building it into a full replacement for general relativity has proved extremely hard.
The majority view is that dark matter is real, unknown material, and that MOND’s successes with individual galaxies are telling us something interesting about how dark matter and ordinary matter are arranged together. The minority view is that the majority has been chasing a particle for forty years and has nothing to show for it. Both sides are right that the argument will be settled by evidence, not by preference, and chapter 14 mentions what the next round of evidence looks like.
Where this leaves us
The case for dark matter rests on five independent lines of evidence: the speeds of galaxies in clusters, the rotation curves of galaxies, gravitational lensing, the pattern of the microwave background, and the growth of cosmic structure. Each on its own could perhaps be argued away. Together, they point to the same amount of the same thing, and the Bullet Cluster shows it behaving like matter.
What that matter is remains unknown. The most-favoured candidate has been sought for thirty years with detectors of exquisite sensitivity and has not turned up. That is not a small embarrassment, and it is one of the reasons the field is unsettled at present.
But dark matter is only a quarter of the universe. Chapter 9 noted that the microwave background demands a flat universe, and that matter of all kinds, dark and ordinary, adds up to only a third of what flatness requires. The other two-thirds is not matter at all. It was discovered, by accident, by two teams who set out to measure how fast the universe was slowing down.
Chapter 11 — The Accelerating Universe
“Some say the world will end in fire, some say in ice.” — Robert Frost, 1920
Measuring the slowdown
By the early 1990s the question about the universe’s future seemed clear, and it was Frost’s question. Gravity pulls everything together, so the expansion must be slowing. The only issue was by how much. Slow enough, and the universe would eventually stop, reverse and collapse back into fire. Not slow enough, and it would coast outwards forever into ice, thinning and cooling without end. The difference came down to how much matter there was, and the way to find out was to measure how much the expansion had slowed since the light from distant galaxies set out.
Two teams set out to make that measurement in the mid-1990s: the Supernova Cosmology Project, led by Saul Perlmutter at Berkeley, and the High-z Supernova Search Team, led by Brian Schmidt in Australia and with Adam Riess doing much of the analysis. They were rivals, and by all accounts not friendly ones. Both used the same tool.
To measure the slowdown you need standard candles, like the Cepheids of chapter 4, but far brighter, bright enough to be seen billions of light-years away. The candidates were a particular kind of exploding star, called a Type Ia supernova.
Standard bombs
A Type Ia supernova is the death of a white dwarf, the collapsed ember left behind when a star like the Sun runs out of fuel; chapter 15 describes them properly. A white dwarf on its own is stable. But if it has a companion star and steals gas from it, or collides with another white dwarf, its mass can creep up towards a critical limit of about 1.4 times the mass of the Sun. At that limit it becomes unstable, its core ignites in a runaway nuclear explosion, and within seconds the entire star is blown apart.
The point for cosmology is that the bomb is always about the same size. Every Type Ia goes off when its white dwarf reaches roughly the same mass, so every one releases roughly the same energy and shines with roughly the same brightness at its peak: about five billion times the Sun, enough to outshine its whole galaxy for a few weeks. They are not perfectly identical, but in 1993 Mark Phillips found that the brighter ones fade more slowly, so the shape of the light curve tells you how bright the explosion really was, and the scatter can be corrected down to about ten per cent.
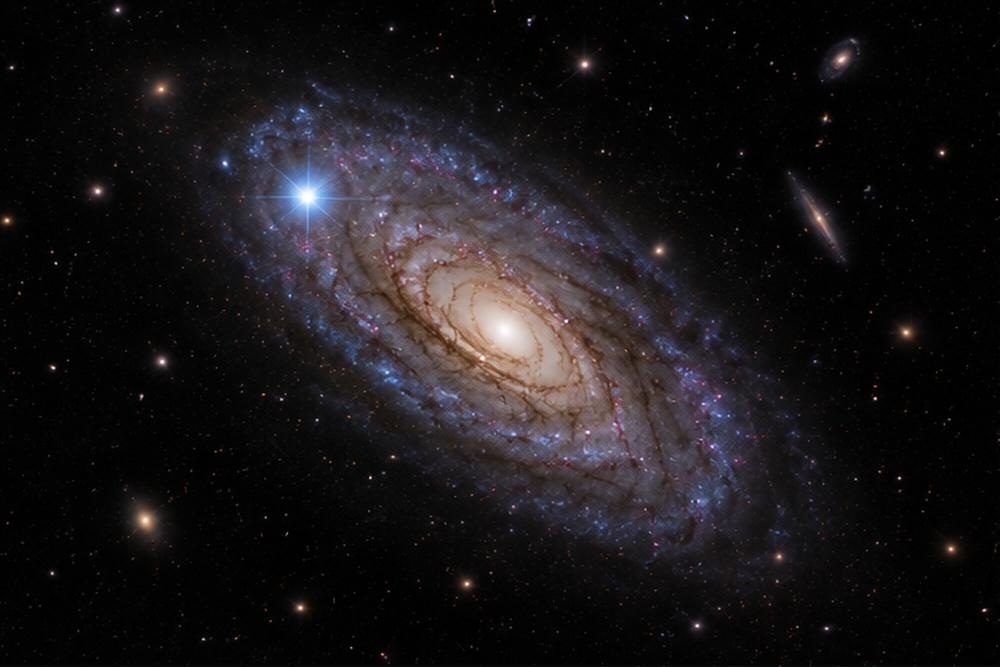
Figure F11-01. A Type Ia supernova in a distant galaxy. For a few weeks one exploding white dwarf rivals the light of a hundred billion stars, and because every such explosion is about equally bright, its faintness reveals its distance.
A ten-per-cent standard candle visible across half the universe is a spectacular tool. The difficulty is finding them. A given galaxy hosts one perhaps every few centuries, and the explosion is at its brightest for only a couple of weeks. The teams solved this by photographing large patches of sky containing thousands of galaxies, then photographing the same patches three weeks later and subtracting one image from the other by computer, so that anything new stood out. They then scrambled for time on the world’s largest telescopes to take spectra before the new points of light faded.
The measurement, once you have the supernovae, is the same one chapter 6 described. Their redshift says how much the universe has expanded since the light set out. Their brightness, compared with what a Type Ia should look like, gives the distance. Plot one against the other, exactly as Hubble did, but at distances ten times greater, and the shape of the curve reveals how the expansion rate has changed over the light’s journey. In a universe that has been slowing down, distant supernovae should look slightly brighter than a simple extrapolation of Hubble’s law predicts, because the expansion used to be faster and the light has not had to travel quite as far as a constant rate would imply.
The shock of 1998
Both teams expected to measure a slowdown. What they found, and announced within weeks of each other in early 1998, was the opposite. The distant supernovae were fainter than expected, by about a quarter. They were further away than they should have been. The expansion had not been slowing down. It had been speeding up.
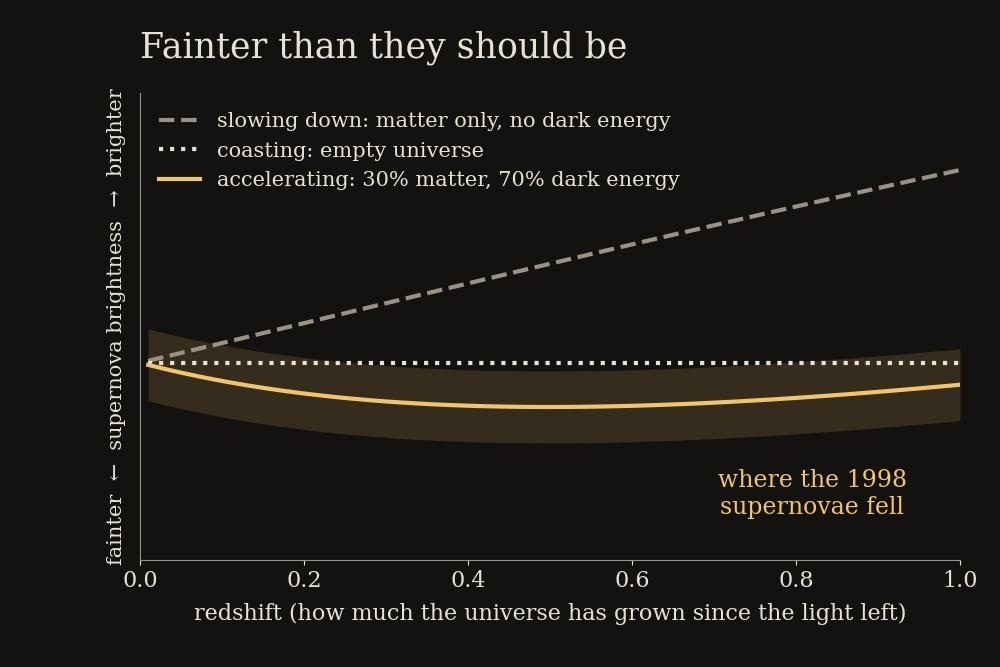
Figure F11-02. The supernova result. Distant supernovae are fainter than a slowing or even a coasting universe would allow: the expansion has been accelerating for billions of years.
Adam Riess, doing the High-z team’s analysis in late 1997, found that the numbers came out most naturally if the universe contained a negative amount of matter, which was obviously absurd, and assumed he had made an error. Weeks of checking found none. The only way to make the matter come out positive was to allow something else, something that pushed. Brian Schmidt later said that his own reaction to the result was somewhere between amazement and horror. Perlmutter’s team, working through the same period from a larger sample, arrived at the same uncomfortable conclusion.
Each team initially suspected a mistake, because the result was so unwelcome. Perhaps the distant supernovae were dimmed by dust on the way. Perhaps supernovae in the early universe, made from stars with fewer heavy elements, were intrinsically fainter. Both possibilities were checked and ruled out over the following years: dust reddens light as well as dimming it, and the distant supernovae were not reddened; and supernovae at even greater distances, seen later by the Hubble Space Telescope, showed the reverse effect, brighter than expected, because before about six billion years ago the expansion really had been slowing, and only later began to speed up. Dust or faint supernovae could not produce that turnover. Only a real change in the expansion rate could.
The two rival teams agreed with each other, which helped. In 2011 Perlmutter, Schmidt and Riess shared the Nobel Prize.
KEY CONCEPT — What “sigma” means
Results like these are reported with a number of “sigma”, and the number will matter for the rest of this book, so it is worth knowing what it means.
Every measurement has an uncertainty, and one sigma is the size of that uncertainty. A result that differs from expectation by one sigma is unremarkable: chance produces that roughly one time in three. Two sigma happens by chance about one time in twenty. Three sigma, about one time in 370. Five sigma, about one time in 1.7 million, and this is the level particle physicists demand before they use the word “discovery”.
The reason for demanding so much is that scientists make thousands of measurements, and if you look at enough of them, some will be three-sigma flukes by chance alone. A three-sigma hint is interesting and worth pursuing. It is not a result. The 1998 supernova measurement was around three to four sigma from each team; what made it convincing was that two independent teams got it, and that other lines of evidence soon converged on the same answer.
Einstein’s constant returns
If the expansion is speeding up, something is pushing. Ordinary matter cannot do it; gravity only pulls. Whatever was responsible had to fill space evenly, since the acceleration is the same in all directions, and had to have the peculiar property that its gravity is repulsive.
Physicists already had such a thing on the shelf. It was the cosmological constant, the term Einstein had added to his equations in 1917 to hold the universe still and thrown away in 1931. Reinstated with the right value, it does exactly what the supernovae need: a universe dominated by matter slows down, but as expansion thins the matter out, the constant, which by definition does not thin, eventually takes over and the expansion begins to accelerate. That takeover happened about six billion years ago, which is why the more distant supernovae showed a slowdown and the nearer ones an acceleration.
The name given to the general idea, whatever it turns out to be, was coined by the cosmologist Michael Turner in 1998: dark energy. The word dark here means unknown rather than invisible, and the phrase has always been a placeholder for something nobody understands.
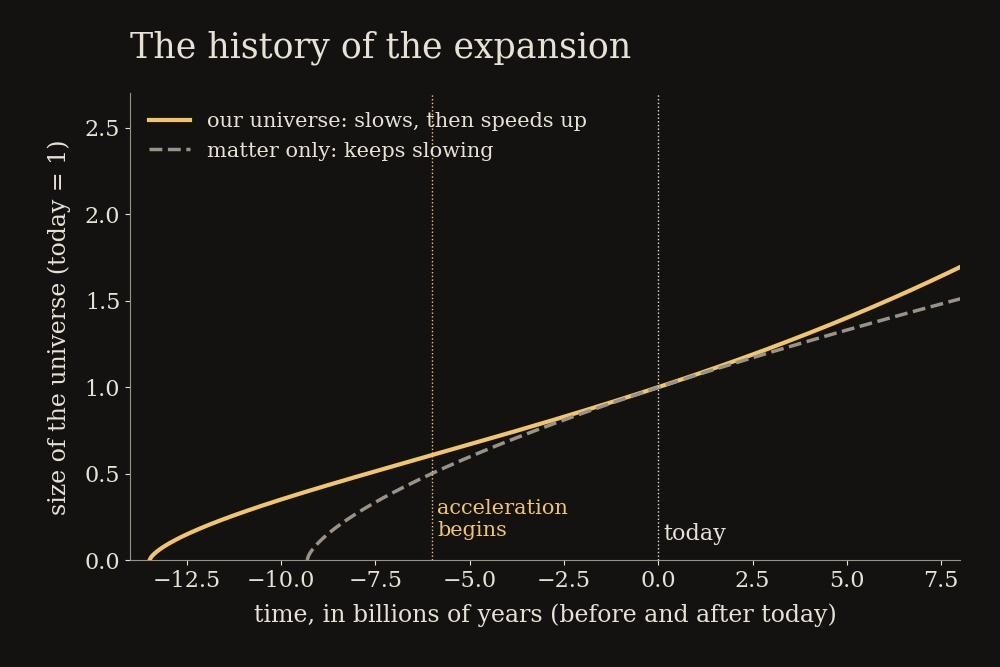
Figure F11-03. The history of the expansion. Gravity slowed it for the first several billion years; then dark energy took over and it began speeding up. The turnover happened about six billion years ago.
Two further pieces of evidence arrived quickly and independently. Chapter 9 explained that the microwave background showed space to be flat, which requires the universe to contain exactly the critical amount of stuff, while all the matter, dark and ordinary, added up to only about a third of it. The missing two-thirds is precisely what the supernovae were demanding. And detailed measurements of the pattern of galaxies in space, described below, gave the same answer by a third route. Three independent methods, one on exploding stars, one on the oldest light, one on the arrangement of galaxies, agreed: about 68 per cent of the universe is dark energy.
KEY CONCEPT — Why energy in empty space pushes
It sounds like a contradiction: how can energy that fills space cause space to fly apart rather than pull together? The answer lies in general relativity, in which gravity responds not only to mass and energy but also to pressure.
A gas has positive pressure: it pushes outwards on its container. Energy that belongs to space itself has the opposite, a negative pressure, a tension, like a stretched rubber band. In Einstein’s equations, pressure contributes to gravity alongside energy, and negative pressure contributes negatively. For the cosmological constant the tension is large enough that its total gravitational effect is repulsive. The more space there is, the more of this stuff there is, and the harder it pushes. That is why it does not thin out with expansion, and why, once it dominates, it wins permanently.
There is a fourth, subtler confirmation, and it is a pleasing one. Microwaves from the wall of fire pass through vast regions of slightly higher and lower density on their way to us. In a universe where the expansion is slowing, a microwave gains energy falling into a large dense region and loses exactly the same amount climbing out, since the region does not change during the crossing. But in an accelerating universe the region has been stretched and diluted by the time the microwave climbs out, so the climb costs less than the fall gave, and the microwave arrives very slightly warmer. Matching the microwave background against maps of where the galaxies are shows exactly this faint warming in the direction of large concentrations of matter. It is a direct sighting of dark energy at work, on the oldest light there is.
KEY CONCEPT — The one number that decides the future
Cosmologists describe dark energy by a single number, usually written w, which measures how its pressure compares with its energy. For Einstein’s cosmological constant, w is exactly minus one: the tension equals the energy density, and the amount of dark energy in each cubic metre never changes, no matter how much the universe expands.
If w is a little more than minus one, say minus 0.9, the dark energy thins out very slowly as space expands, and its push gradually weakens. If it is less than minus one, the dark energy grows stronger with time, and the acceleration runs away. And w need not stay fixed; it could have been one value in the past and be drifting to another now.
Every survey described in this chapter is, at bottom, an attempt to measure w and to find out whether it has changed. A cosmological constant sits at exactly minus one forever. The hints from 2024 and 2025 are that it may have been slightly below minus one in the past and be drifting upwards towards it now, which would mean dark energy is fading. The whole of chapter 21 turns on what that number turns out to be.
The worst prediction in physics
The natural physical interpretation of the cosmological constant is that empty space has an energy of its own. This is not a strange idea in modern physics. Quantum theory says that what we call the vacuum is not empty but seethes with fleeting particles that appear and vanish, and that even at the lowest possible energy, “empty” space retains a residual energy. This vacuum energy has measurable effects in the laboratory: two metal plates placed extremely close together are pushed towards each other by it.
So physicists tried to calculate how much vacuum energy there should be, and compare it with the amount the supernovae required. The calculation, done straightforwardly, gives an answer larger than the observed value by a factor of about 10¹²⁰: a one followed by a hundred and twenty zeros. It has been called the worst prediction in the history of physics, and the description is fair.
The disagreement is so absurd that it must be telling us something. Perhaps the various contributions to the vacuum energy cancel almost, but not quite, exactly, for some reason nobody has found. Perhaps dark energy is not vacuum energy at all but some new field filling space, slowly changing over time, which theorists have called quintessence after the fifth element of the ancient Greeks. Perhaps general relativity itself needs modifying on the largest scales. Or perhaps, on the most radical proposal, the value is small because only in a universe where it is small could galaxies, stars and observers form, an argument taken up in chapter 22.
There is a second puzzle, quieter but nagging. Dark energy took over from matter about six billion years ago, and today the two are within a factor of about two of one another. But the matter density has been falling steadily throughout cosmic history while dark energy has stayed constant; for most of the past and future they differ by enormous factors. Why should we happen to be living in the brief era when they are nearly equal? This coincidence may be exactly that, a coincidence. It may also be a clue that dark energy is not constant after all.
Mapping the ripples
The third line of evidence came from the sound waves of chapter 9, and it has become the sharpest tool for studying dark energy.
When the fog lifted, the frozen sound waves were imprinted not only on the radiation but on the matter. Around every original over-dense spot, a shell of slightly enhanced density had spread outwards to the sound horizon, about 450,000 light-years at the time, and when the sound stopped it stayed there. Over the following billions of years, galaxies formed preferentially both at the original spots and on the shells around them. So today, galaxies are very slightly more likely than average to be found separated by one particular distance: the sound horizon, stretched by the expansion to about 480 million light-years.
This is a ruler. It has a known length, set by physics in the first 380,000 years, and it is stamped into the pattern of galaxies at every era. Measure how large it looks in the sky at different redshifts, and you have the expansion history directly, by geometry, with none of the worries about dust or the brightness of exploding stars. Astronomers call the effect baryon acoustic oscillations, and it works exactly as the surveyor’s trick of pacing out a known distance does.
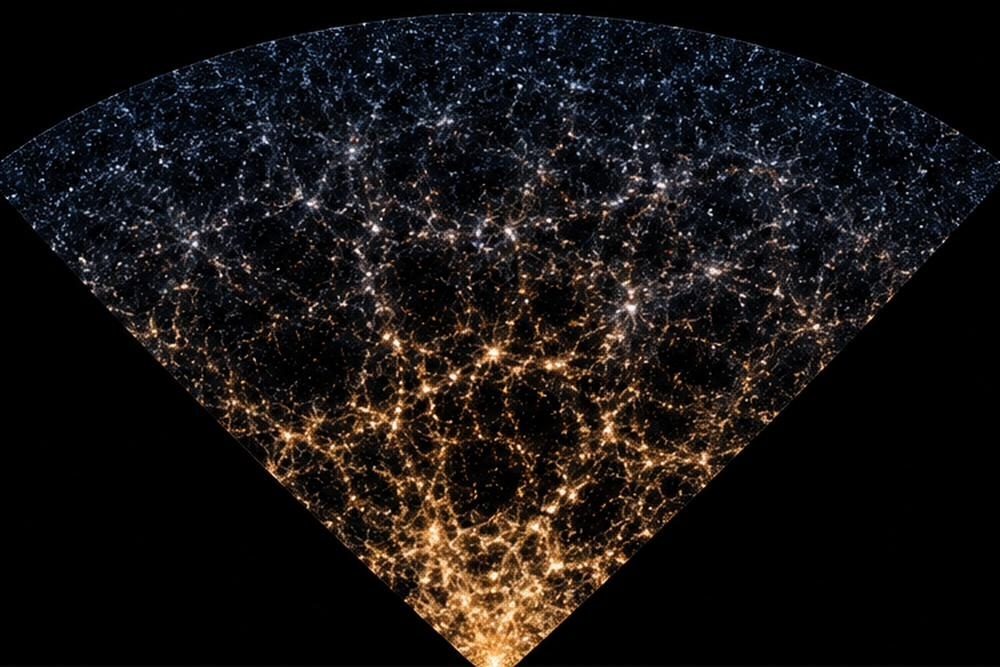
Figure F11-04. A slice of a galaxy map. Each point is a galaxy with a measured redshift; the faint preferred spacing between them is a ruler left over from the first 380,000 years.
Using it requires the positions and redshifts of millions of galaxies, so it became possible only with instruments built for the purpose. The most powerful is the Dark Energy Spectroscopic Instrument, DESI, a device of five thousand robotic fibre-optic positioners mounted on the Mayall telescope in Arizona, each fibre repositioning itself on a fresh galaxy every twenty minutes.
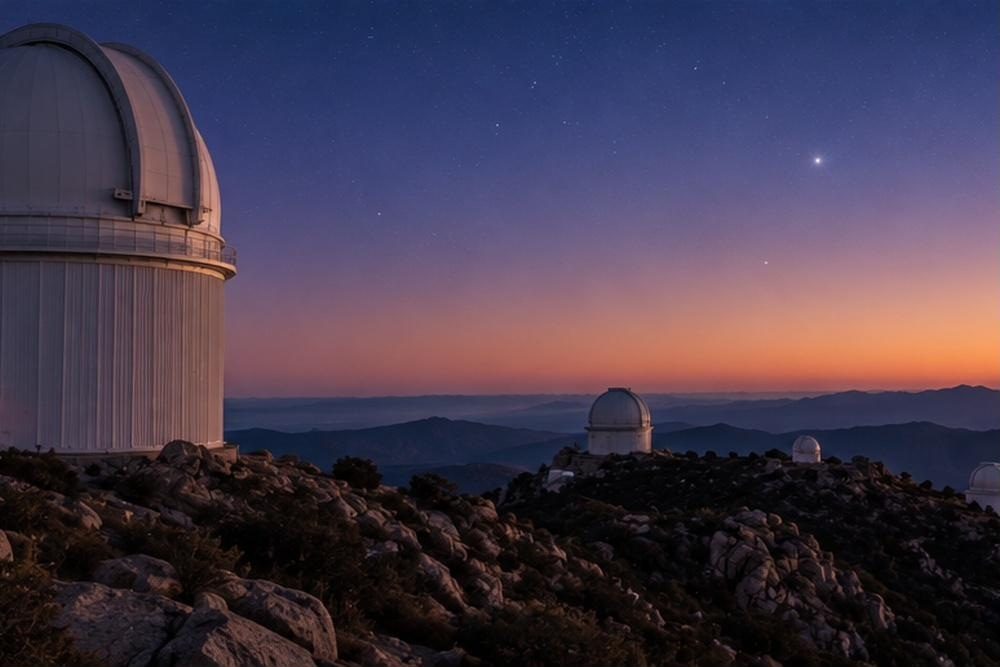
Figure F11-05. The Mayall telescope on Kitt Peak, Arizona, home of DESI. Five thousand robotic fibres take the spectra of five thousand galaxies at once, night after night, to map the expansion history.
Is dark energy changing?
Which brings this chapter to the present, and to an argument that was live when these words were written.
DESI began its survey in 2021, and in April 2024 published results from its first year. Alone, they were consistent with a cosmological constant. But combined with the microwave background and with the supernova data, they fitted slightly better if dark energy was not constant but had been weakening over the past few billion years. The hint was around two and a half to four sigma, depending on which supernova catalogue was included.
In March 2025 the collaboration released its analysis of the first three years, with nearly fifteen million galaxies and quasars: more than double the earlier sample. The hint did not go away. It strengthened, sitting between about three and four sigma across the different combinations. Taken alone, the DESI data still fit a constant; it is the combination of DESI with the microwave background and the supernovae that pulls away from it. Meanwhile the Dark Energy Survey, using a different method based on weak lensing, published its final analysis in 2026 and found no significant preference either way, which is a useful reminder that the case is not closed.
The survey finished its planned five-year run in the spring of 2026, having mapped more than forty-seven million galaxies and quasars, and has been extended into 2028. The full five-year analysis is expected in 2027, and it is the single result cosmologists are waiting for most eagerly. If the hint reaches five sigma, the simplest model of the universe, in which dark energy is Einstein’s constant, will be finished, and the question of what replaces it will be wide open.
If dark energy really is weakening, the consequences are large. A cosmological constant means eternal acceleration and Frost’s ice. A dark energy that fades could mean a universe whose acceleration peters out, or, in some models, one that eventually reverses and collapses. Chapter 21 lays out the possibilities. It is a strange thing to be living through: the fate of the universe, an open question again, awaiting a data release.
The surveys of the 2020s
DESI is not alone. Three other instruments are attacking the same question by different routes, and their results will arrive through the second half of the decade.
The European Space Agency’s Euclid satellite, launched in July 2023, is photographing a third of the sky in visible and infrared light with a sharpness only possible above the atmosphere, to measure the shapes of over a billion galaxies for weak lensing and the positions of tens of millions for the acoustic ruler. Its first year of survey data is due for release from late 2026, with the dark-energy analysis following in 2027.
The Vera C. Rubin Observatory in Chile, which began its ten-year survey in June 2026, is photographing the entire southern sky every few nights with the largest digital camera ever built, and will discover millions of supernovae, hundreds of thousands of them Type Ia, dwarfing the sample of a few dozen that made the 1998 discovery.
And NASA’s Nancy Grace Roman Space Telescope, launched on 30 August 2026, combines a Hubble-sized mirror with a field of view a hundred times larger, and is designed specifically to measure dark energy through supernovae, lensing and the acoustic ruler at once.
Between them, these four instruments should settle within a few years whether dark energy is constant. Chapter 14 returns to all of them.
Where this leaves us
The universe’s expansion is accelerating. That has been established by three independent methods and is not in serious doubt. About 68 per cent of the universe consists of whatever is responsible, and nobody knows what it is. The simplest candidate, the energy of empty space, fits the data adequately and is predicted by theory to be wrong by a factor of 10¹²⁰. The latest and largest survey hints that it is not constant after all, at a level that is suggestive but not decisive.
That is the honest state of the subject in 2026. Part II has one more piece of the standard picture to describe, and it is the earliest of all: the fraction of a second that set the stage for everything since, and put the ripples into the microwave background in the first place.
Chapter 12 — The First Split Second: Inflation
“This kind of supercooling can explain why the universe today is so incredibly flat.” — Alan Guth, notebook entry headed “SPECTACULAR REALIZATION”, 6 December 1979
Three puzzles
By the late 1970s the hot Big Bang was orthodox, and it worked. It explained the expansion, the helium, the microwave background. But it had a peculiar weakness that its own success made obvious: it explained how the universe had evolved from a hot, dense, smooth, flat beginning, and it said nothing at all about why the beginning should have been hot, dense, smooth and flat. Three features of the starting conditions, in particular, looked like outrageous coincidences.
The first is the horizon problem, and it is the most important. Look at the microwave background in one direction, then turn round and look in the opposite direction. The two patches of sky are at the same temperature, to about one part in a hundred thousand. That is what you would expect if they had once been in contact and had time to settle to a common temperature, the way two ends of a metal bar end up equally warm. But in the standard picture they had never been in contact. Light from one of those patches has only just reached us, after travelling for 13.8 billion years, and it has certainly never reached the other patch, which lies twice as far away on the other side. Nothing from one could ever have influenced the other. Yet they match.
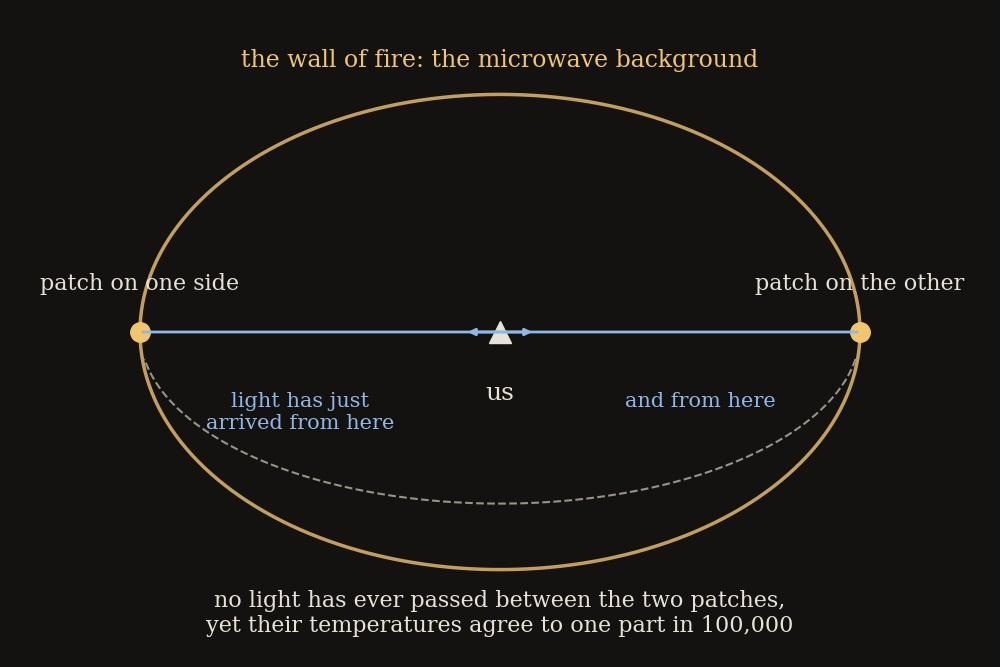
Figure F12-01. The horizon problem. Two patches on opposite sides of the sky have had no contact since the beginning, yet are at the same temperature. Something must have brought them into agreement before they separated.
Working the numbers out properly, the sky is made up of tens of thousands of separate patches, each a degree or so across, that in the standard picture have had no chance to exchange so much as a photon with each other since the beginning. Their agreement to five decimal places is either an astonishing coincidence or evidence that the standard picture is missing something.
The second is the flatness problem. Chapter 9 explained that space today is flat to within a fraction of a per cent. The trouble is that flatness is unstable: any small departure from it in the early universe grows enormously as the universe expands, in the same way that a pencil balanced on its point falls further and further from vertical. For the universe to be as flat as it is now, it had to be flat at one second to about one part in a million billion, and at the earliest times we can describe, to something like one part in 10⁶⁰. Nobody could think of a reason why it should have started out so precisely balanced.
The third puzzle was more technical. The theories that particle physicists were developing at the time predicted that the very early universe should have produced a great many exotic, extremely heavy relics of a type called magnetic monopoles, and that these should be common enough today to be easily found. None has ever been seen.
The spectacular realisation
Alan Guth was a young particle physicist in 1979, not a cosmologist, working on exactly that monopole problem, and worrying about his job prospects. The mechanism he was investigating involved the early universe getting stuck, briefly, in a state that physicists call a false vacuum: a condition of space that is not the lowest possible energy but is temporarily stable, like water that has been cooled below freezing without yet turning to ice.
On the night of 6 December 1979 he realised that a universe stuck in such a state would have a remarkable property. A false vacuum has energy, and energy that belongs to space itself has the repulsive gravity described in chapter 11. But this energy would have been enormously greater than today’s dark energy, by a factor of about 10¹⁰⁰. Space in that condition would not merely accelerate its expansion. It would explode outwards at a rate that doubled its size every 10⁻³⁷ seconds or so, and keep doubling, and doubling again, for as long as the false vacuum lasted.
Guth called the idea inflation, and wrote the words “SPECTACULAR REALIZATION” at the top of his notebook page. He had seen at once that it disposed of the flatness problem, and within days that it dealt with the horizon problem and the monopoles too.
THE EQUATION — Doubling, and doubling again
Inflation works by doubling, and doubling is far more powerful than intuition expects. There is an old story about a king who agreed to reward a courtier with one grain of rice on the first square of a chessboard, two on the second, four on the third, and so on, doubling for each of the sixty-four squares. By the last square the reward is 2⁶⁴ grains, about eighteen billion billion, more rice than the world has ever grown.
The useful rule is that ten doublings multiply by about a thousand, since 2¹⁰ is 1,024. Twenty doublings give a million. Thirty give a billion. A hundred doublings give 2¹⁰⁰, which is about 10³⁰: a million trillion trillion.
Inflation needs to have doubled the size of the universe at least eighty or ninety times, and may have done so far more. Ninety doublings multiply a length by about 10²⁷. A region the size of a proton, inflated ninety times, becomes larger than the solar system. A region far smaller than a proton becomes the whole of the observable universe.

Figure F12-02. Doubling on a chessboard. One grain, then two, then four; by the end of the board the total exceeds all the rice ever grown. Inflation doubled the size of the universe at least eighty times.
How doubling solves the puzzles
Take the horizon problem first. Before inflation, the region that would become our entire observable universe was minute, far smaller than a proton, and its parts were in intimate contact, with ample time to reach a common temperature. Inflation then stretched that one tiny, uniform patch to a size larger than everything we can now see. The two opposite sides of the microwave sky match because they were once next-door neighbours, torn apart faster than light could keep up.
That last phrase needs a word of explanation, because relativity forbids anything from travelling faster than light. But nothing was travelling. The two regions were not moving through space; space between them was stretching, and there is no speed limit on that. It is the same distinction chapter 6 drew for the expansion today, taken to an extreme.
Now flatness. Blow up a balloon a little, and its surface is obviously curved. Blow it up to the size of the Earth, and any patch you can stand on looks flat. Inflation blew up whatever curvature the early universe had by a factor of 10²⁷ or more, and any patch the size of the observable universe was left flat to a precision far beyond anything we could measure. Inflation does not need the universe to have started flat. It flattens it. Indeed, it predicted in 1980 that the universe would be found to be flat, at a time when the evidence pointed the other way. Chapter 9 recorded the result.
The monopoles simply get diluted. Any relics made before inflation are spread out over an unimaginably larger volume, and the expected number in the whole observable universe drops to one or fewer.
Inflation, then, took three unexplained coincidences in the initial conditions and replaced them with a single physical process. What it did not do, in Guth’s first version, was stop gracefully. His false vacuum decayed in bubbles that could not merge properly, leaving a universe far lumpier than ours. Within two years Andrei Linde in Moscow, and independently Andreas Albrecht and Paul Steinhardt in Pennsylvania, found versions in which the transition was smooth: the field driving inflation rolled slowly down an energy slope rather than leaping off a cliff, and inflation ended gracefully everywhere at once, dumping its energy into a hot soup of particles. That soup is the hot Big Bang of chapter 8. In the inflationary picture, the Big Bang is not the beginning but the end of inflation.
Guth was not quite the first. In Moscow in 1980, Alexei Starobinsky had published a model of the early universe with a similar burst of accelerated expansion, arrived at from a different direction, as a way of avoiding the singular beginning implied by general relativity. His version, which grew out of quantum corrections to gravity itself, remains one of the best-fitting inflation models to this day. As with Friedmann and Lemaître in chapter 6, an idea had appeared in two places at once, and the version that caught on was the one told most clearly to the largest audience.
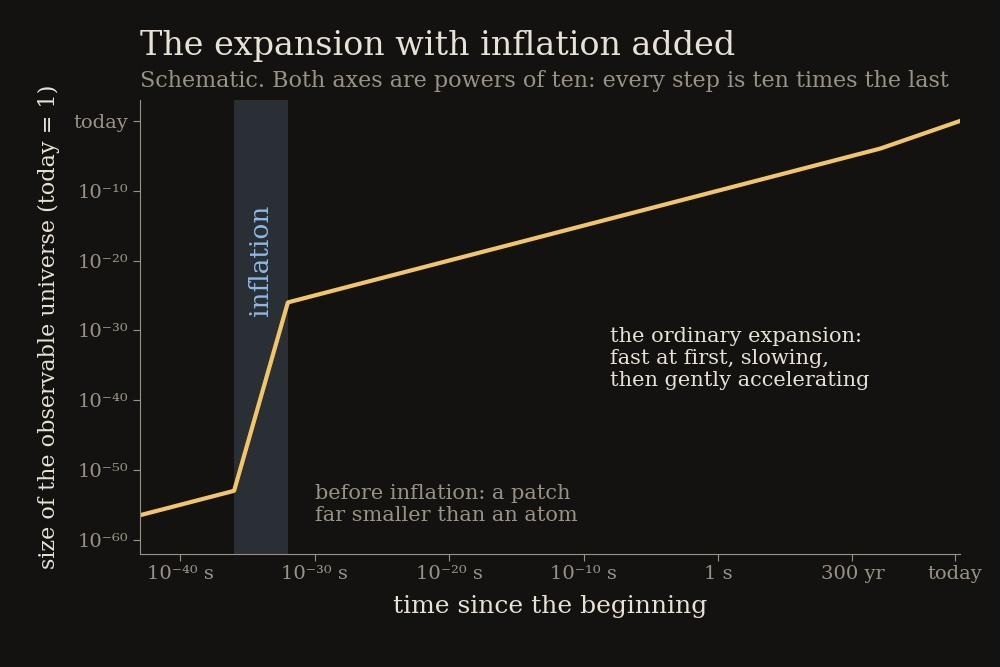
Figure F12-05. The expansion with inflation added. A patch far smaller than an atom is stretched to cosmic size in a fraction of a second; everything since, including the whole of chapter 11, is the gentle tail on the right.
KEY CONCEPT — What did the inflating?
Physicists describe inflation as being driven by a field, usually called the inflaton, and the word deserves a plain explanation. A field is something that has a value at every point in space. Temperature is a field: every point in a room has one. The magnetic field around a magnet is another. In modern physics the fundamental particles themselves are understood as ripples in fields of this kind, and the Higgs field, whose particle was found at CERN in 2012, is one that fills all of space with a constant value even in a vacuum.
The inflaton is a proposed field of that sort, whose energy, for a brief period, dominated the universe. While its value was high, the energy behaved like an enormous cosmological constant and drove the doubling. As it rolled down to its lowest energy, inflation ended, and the energy it released became the particles of the hot Big Bang. What the inflaton actually is, and whether it is related to the Higgs field or to anything else already known, is not established. It is a placeholder name for whatever did the job, much as dark energy is.
Quantum seeds of galaxies
This much was a tidy solution to three puzzles. What turned inflation into a theory that could be tested came next, and it is one of the most beautiful ideas in physics.
Inflation, taken at face value, would seem to produce a universe that is too smooth. If the whole observable universe grew from a tiny uniform patch, where did the lumps come from, the ripples in the microwave background that grew into galaxies?
The answer came from quantum mechanics, in a series of papers in 1982 by Stephen Hawking, Guth and others. On the smallest scales, quantum theory forbids anything from being perfectly smooth or perfectly still; there is an irreducible jitter in every field, including the field that drove inflation. Ordinarily those jitters are unimaginably tiny and average out. But inflation stretched them. A fluctuation the size of an atomic nucleus, caught by the expansion, was blown up in a fraction of a second to the size of a galaxy cluster, and frozen in place as a region very slightly denser or thinner than its surroundings.
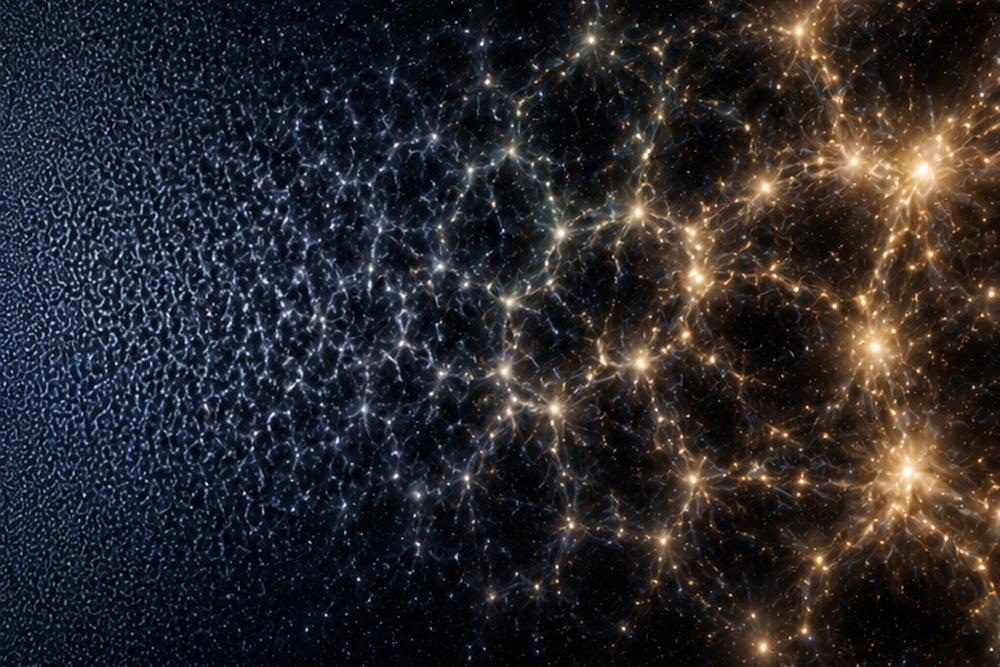
Figure F12-03. From quantum jitter to galaxy. Fluctuations far smaller than an atom, stretched by inflation to cosmic size, became the ripples in the microwave background and eventually the galaxies.
Every galaxy, every cluster, every filament of the cosmic web, on this account, began as a quantum fluctuation smaller than a proton in the first 10⁻³² seconds. The largest structures in the universe are the smallest things in the universe, magnified.
And this is testable, because the theory predicts what the ripples should look like. They should be present on every scale, with almost exactly the same strength on each, because every scale was created by the same process at a different moment of the stretching. Not quite the same strength: because the energy driving inflation was very slowly falling as it went, ripples stretched later, which are the smaller ones today, should be very slightly weaker than the ones stretched earlier. The ripples should be random in a specific statistical sense, like the noise on a radio. And they should be the same in the matter and the radiation together, rather than one lumpy and the other smooth.
The microwave background, as measured by WMAP and Planck, agrees with every one of those predictions. The slight tilt in particular, a few per cent weakening from large scales to small, was measured by Planck at precisely the level the simplest inflation models had predicted a decade before the measurement was possible. It is the kind of prediction, made in advance and later confirmed, that chapter 7 said to look for.
The dust of 2014
There is one more prediction, and it is the one that would settle the matter.
Inflation stretches every kind of quantum jitter, and one of them is the jitter of spacetime itself. So inflation should have produced gravitational waves, ripples in space with wavelengths as large as the universe, which would have left a faint but characteristic swirl in the polarisation of the microwave background. The swirl is called a B-mode, and its strength depends directly on how energetic inflation was. Find it, and you have not only confirmed inflation but measured the energy scale at which it happened, which for most models is not far below the point where all the forces of nature are thought to merge.
On 17 March 2014 a team running a telescope at the South Pole, called BICEP2, announced that they had found it, and found it strong. The signal was several times larger than most theorists expected, which made it all the more dramatic. A video of Andrei Linde, one of inflation’s inventors, being told the news on his doorstep and calling for champagne circulated around the world. Newspapers announced the confirmation of inflation and speculated about a Nobel Prize.
The difficulty was dust. The Milky Way is full of tiny grains of dust, aligned by the galaxy’s magnetic field, which glow faintly at microwave wavelengths with a polarisation of their own, and that polarisation can mimic a B-mode. BICEP2 had observed a patch of sky chosen because it looked relatively clean, and had estimated the dust contamination from the best information available. Within weeks it became clear that the estimate was too low; the Planck team had better dust maps, and when the two groups combined their data in a joint analysis published in early 2015, the whole signal was consistent with dust. There was no detection.
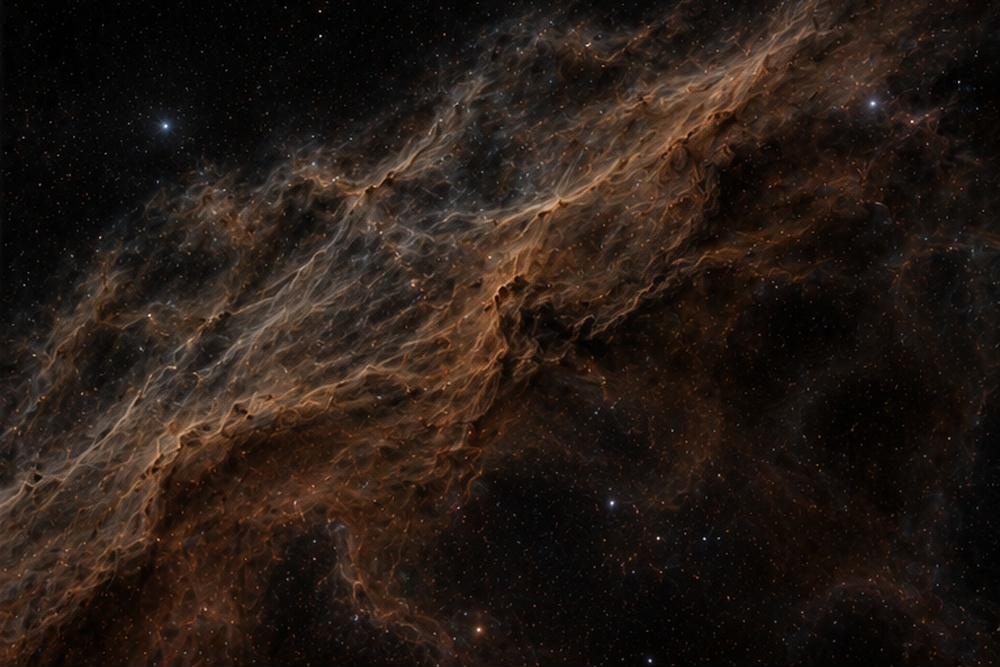
Figure F12-04. Galactic dust. Fine grains aligned by the Milky Way’s magnetic field glow faintly polarised at microwave wavelengths, and in 2014 that glow was mistaken for the fingerprint of inflation.
It was a painful episode, and an instructive one. The team had announced by press conference before their paper was refereed, and had been carried along by the excitement of a result that everyone wanted to be true. Nothing was fraudulent; the mistake was a defensible judgement about dust that turned out to be wrong. But the field has been more cautious since.
The hunt continues, with better telescopes and far better dust maps. The combined BICEP and Keck experiments at the South Pole, working with Planck data, had pushed the limit on the gravitational-wave signal down by a factor of about five from the 2014 claim by 2021, and it has fallen further since. The Simons Observatory in Chile, which began observations in 2024, is designed to go several times deeper again. A Japanese-led satellite, LiteBIRD, is planned for the early 2030s to survey the whole sky for the signal. The simplest inflation models predict a signal within reach of these instruments; some others predict one far too weak to find. Either result would be informative.
Doubters
Inflation is the standard account of the earliest instant, and it is taught in every cosmology course. It also has serious, well-qualified critics, and one of them helped invent it.
Paul Steinhardt, who with Albrecht found the first working version in 1982, became over the following decades one of inflation’s most persistent opponents. His objections, shared by some other physicists, are of three kinds.
The first is that inflation requires its own starting conditions. To get going, the field that drives it has to begin in a particular state, smooth and slowly rolling over a large enough region, and critics argue that this is itself an unlikely starting condition, so that inflation has moved the puzzle rather than solved it.
The second is that inflation, once it starts, seems never to stop everywhere. In most versions, the quantum jitters that seed galaxies also mean that some regions keep inflating while others stop, and the inflating regions grow so fast that they always dominate. The result is eternal inflation: an endless, ever-growing expanse of inflating space, within which “bubble universes” like ours are forever nucleating, each with potentially different physical properties. Chapter 22 discusses this multiverse. To its supporters it is a fascinating consequence; to its critics it is a disaster, because a theory that produces every possible outcome somewhere predicts nothing.
The third objection follows from the second. Inflation comes in hundreds of versions, with adjustable ingredients, and its critics argue that between them they can accommodate almost any observation, so that the theory can be adjusted to fit rather than being put at risk. Its defenders reply that the core predictions, flatness, the near-uniform ripples and their slight tilt, were made in advance and have all been confirmed, and that the gravitational-wave test remains genuinely open.
The argument became public in 2017, in duelling articles and a letter signed by thirty-three physicists including Hawking, and it has not gone away. Alternatives exist, in which the universe did not inflate but bounced from a previous contracting phase; they too are described in chapter 22. For the present, the honest summary is that inflation explains the early universe better than any rival, that its central predictions have passed every test, and that its foundations are more contested than a textbook usually admits.
Where this leaves us
With inflation, the standard picture of the universe is complete, from a fraction of a second after the beginning to the present day. It runs as follows. An early burst of inflation stretched a tiny patch to cosmic size, flattened it, made it uniform, and seeded it with quantum ripples. Inflation ended in a hot Big Bang. The first minutes forged hydrogen and helium; at 380,000 years the fog lifted and the microwave background was released; dark matter, already clumping, drew the ordinary matter into the cosmic web; the first stars lit up; galaxies grew; and about six billion years ago dark energy began to accelerate the expansion.
Cosmologists call this picture Lambda-CDM, after its two dominant ingredients: Lambda, the Greek letter for the cosmological constant, and cold dark matter. It has six adjustable numbers and it fits essentially everything, from the light-element abundances to the pattern of galaxies today.
It is also under strain. Two of its ingredients are unidentified. Its earliest stage is contested. Its favoured dark-matter candidate has failed to appear. Its dark energy shows hints of not being constant. And, as the next chapter describes, its two most careful measurements of the present expansion rate disagree with one another.
Chapter 13 — Cracks in the Cosmos
“Extraordinary claims require extraordinary evidence.” — Carl Sagan, 1980
The model that works almost too well
Part II has assembled the standard model of cosmology piece by piece, and it is worth pausing to admire it before finding fault.
Lambda-CDM, to give it its name, describes a flat universe 13.8 billion years old, made of five per cent ordinary matter, twenty-seven per cent cold dark matter and sixty-eight per cent dark energy in the form of a cosmological constant, seeded by inflation with almost uniform ripples. With just six adjustable numbers it accounts for the light-element abundances from the first minutes, the temperature and every measured wiggle in the pattern of the microwave background, the distribution of galaxies across the sky and through time, the acoustic ruler, the supernova distances, the growth of clusters, the bending of light by dark matter, and the age of the oldest stars. No competing model comes close. Cosmologists who complain about it, and there are plenty, are complaining about a theory that has passed a hundred tests.
Which is what makes the exceptions interesting. A theory this good, when it fails, fails informatively. The failures are called tensions, a word cosmologists use for measurements that disagree with each other, or with the model, more than their uncertainties allow, but not yet by enough to declare that something is definitely broken. This chapter is about the most stubborn of them, which concerns the simplest number in the subject: how fast the universe is expanding right now.
Two roads to one number
The Hubble constant, the rate of expansion today, can be found in two fundamentally different ways.
The first is the old way, the way Hubble did it: measure distances to galaxies, measure their redshifts, and take the ratio. This is the late-universe route, or the local route, and it is direct. It uses no cosmological theory at all beyond the assumption that the universe is expanding. Its difficulty lies entirely in measuring distances, which, as this book has repeatedly shown, is the hardest thing in astronomy.
The second is new, and it works from the other end of time. Take the microwave background, whose pattern was fixed when the universe was 380,000 years old. Chapter 9 explained that its peaks encode the contents and geometry of the universe with great precision. Feed those into the standard model, run the expansion forward through 13.8 billion years of physics, and out comes a prediction for the expansion rate today. This is the early-universe route. It is extraordinarily precise, but it is a prediction, not a measurement: it depends on every ingredient of the model being right.
Figure F13-04. Two rulers that disagree. Each route to the expansion rate is precise to about one per cent, and they differ by nine. At least one of them is measuring something other than what its makers think.
The two routes should agree. Until about 2013 they did, within their uncertainties, which were then a few per cent. Since then both have sharpened, and as they sharpened they pulled apart.
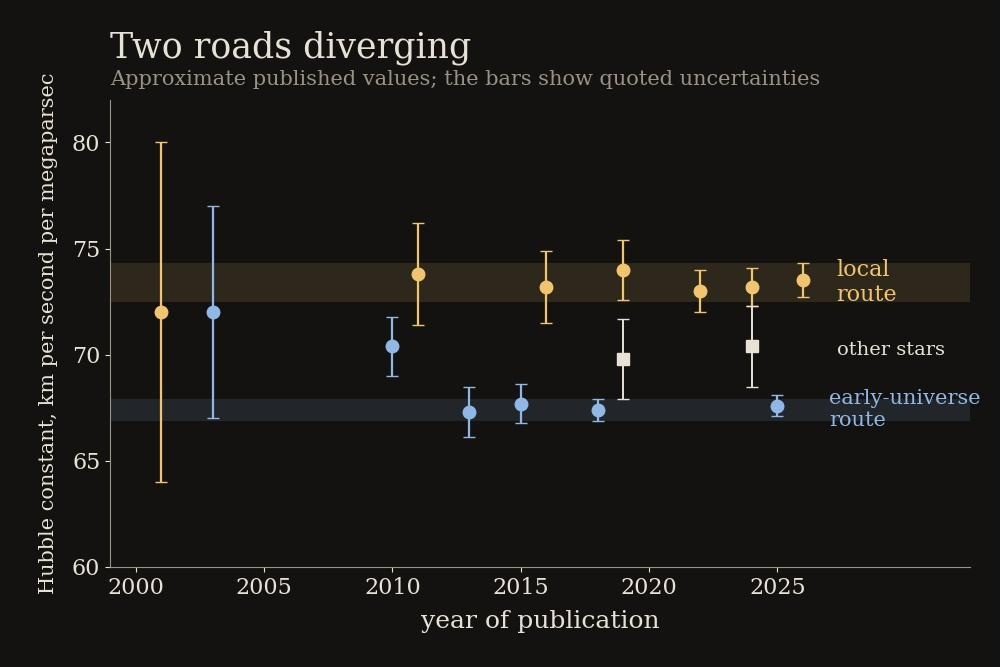
Figure F13-01. Two roads diverging. Each point is a published measurement with its uncertainty. The early-universe route settles at about 67, the local route at about 73, and neither has moved towards the other in a decade.
The early-universe route, from Planck and confirmed by the Atacama Cosmology Telescope in 2025, gives about 67.4 kilometres per second per megaparsec, with an uncertainty of about half a unit. The local route, from the group led by Adam Riess that calls itself SH0ES, has given about 73 for over a decade, and in April 2026 a broad international collaboration of nearly forty astronomers, combining every local method into a single network of cross-checks, published 73.5 with an uncertainty of 0.8. The gap is about six units, or nine per cent. Set against the uncertainties, it is a disagreement at roughly six sigma, and some analyses put it higher. By the standard chapter 11 explained, that is well past the level at which physicists ordinarily say something real is going on.
The distance ladder
To understand where the argument lies, it helps to see how the local number is built, because it is built in stages, like a ladder, and each rung can be questioned.
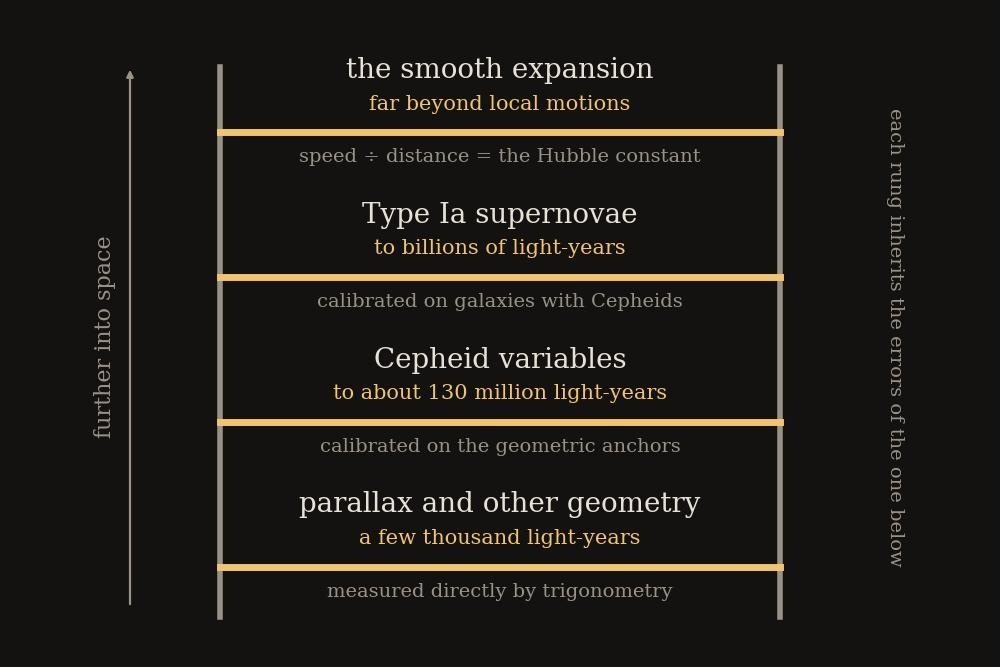
Figure F13-02. The distance ladder. Each rung calibrates the next: parallax fixes the Cepheids, the Cepheids fix the supernovae, and the supernovae reach far enough to measure the expansion cleanly.
The bottom rung is geometry. Chapter 3 described parallax, the direct trigonometric distance to nearby stars, and the European Gaia satellite has measured it for over a billion stars, including hundreds of Cepheids in our own galaxy. Two other geometric anchors support this rung: the distance to the Large Magellanic Cloud, fixed to about one per cent by watching pairs of eclipsing stars, and the distance to the galaxy NGC 4258, fixed by tracking clouds of water vapour orbiting the black hole at its centre, whose motions can be measured with radio telescopes to give a distance by pure trigonometry.
The second rung is the Cepheids of chapter 4. Calibrated on the geometric anchors, Leavitt’s law gives the distance to any galaxy where Cepheids can be found and timed. That reaches out to about 130 million light-years, far enough to include a few dozen galaxies in which a Type Ia supernova has happened to explode in the last few decades.
The third rung is those supernovae. Chapter 11 explained that they are standard candles good to about ten per cent each. Knowing the distances to the galaxies that hosted them, from the Cepheids, fixes their true brightness. Then any Type Ia anywhere gives a distance.
The fourth rung is the reach. Supernovae are seen out to billions of light-years, comfortably beyond the region where the random motions of galaxies, a few hundred kilometres a second, are small compared with the expansion. Out there the ratio of speed to distance is clean, and the ratio is the Hubble constant.
Every rung inherits the errors of the one below, which is the weakness of any ladder. But every rung has also been checked by independent means, which is its strength.
The 2026 analysis took this idea further and, in effect, replaced the ladder with a net. Instead of climbing one route from anchors to Cepheids to supernovae, it tied together every available distance indicator, Cepheids, red giants, carbon stars, the sizes of galaxies, the brightness of their brightest star clusters and more, along with every geometric anchor, into a single web of measurements, each of which constrains the others. The point of a net rather than a ladder is that a single broken strand does not bring the whole thing down: if one method is quietly wrong, the others pull the answer back towards the truth, and the analysis can show how much the result shifts when any one method is removed. The answer was that it barely shifts at all.
KEY CONCEPT — When does a tension become a discovery?
Chapter 11 introduced sigma as the measure of how far a result sits from expectation. By that yardstick, the Hubble tension has passed five sigma, and particle physicists would have called it a discovery years ago. Cosmologists have been more cautious, and it is worth understanding why.
A discovery in particle physics usually means a bump in a graph that either is or is not there, in a detector whose behaviour is understood in detail. The Hubble tension is a disagreement between two long chains of inference, each with many links, each link with its own uncertainty, and the quoted error bars capture only the uncertainties people have thought of. The unknown unknowns, the errors nobody has yet imagined, do not appear in the sigma count. So the honest reading is not that the tension is “six sigma real” but that it is six sigma against every error anyone has managed to think of, which is a weaker but still impressive claim.
The tension will become a discovery when one of two things happens: when an error is found, in which case it was never a discovery, or when some new physics predicts the discrepancy and also predicts something else that is then observed. Explanations offered after the fact do not count for much, for the reason chapter 7 gave. What would settle it is a prediction.
Rungs under scrutiny
For ten years the natural suspicion was that the local ladder had a fault somewhere. Almost every rung has been accused, and each accusation has been tested.
The most persistent concerned the Cepheids. The Hubble Space Telescope, which took most of the measurements, has trouble separating a Cepheid from its neighbours in the crowded discs of distant galaxies; if unnoticed neighbouring stars were adding their light, the Cepheids would look too bright, the galaxies too close, and the constant too high. This was a reasonable worry. The James Webb Space Telescope, with far sharper vision, settled it. Riess’s group used JWST to re-observe over a thousand Cepheids in the anchor galaxy and in several supernova hosts and found that the Hubble measurements had been right, with crowding ruled out as the cause of the tension at high confidence.
A second line of attack was to bypass the Cepheids altogether. Wendy Freedman’s group in Chicago, long the most careful sceptics of the tension, built alternative second rungs from two other kinds of star: the brightest red giants in a galaxy’s outskirts, which reach a well-defined maximum brightness before they die, and a class of carbon-rich stars whose brightness is nearly uniform. Both live in the sparse outer regions of galaxies where crowding is not a problem. In 2024 her group published results from JWST using all three methods. The red giants and the carbon stars gave values around 69 to 70, comfortably closer to the early-universe number. The Cepheids gave about 73, the same as Riess.
This was not the resolution anyone wanted. It meant that the disagreement existed within the local measurements themselves, between different kinds of stars observed with the same telescope, which suggested that at least one of the stellar rungs was not quite understood. Riess’s group argued, with some justice, that Freedman’s samples were small and that the differences were consistent with chance; the 2026 network analysis, which folded in all these methods and let each cross-check the others, concluded that removing any single method barely changed the answer, and that no single overlooked error in the local measurements could account for the gap.
Meanwhile the early-universe route was being checked too, by methods that do not depend on the microwave background at all. The acoustic ruler of chapter 11, combined with the light-element abundances of chapter 8, gives an independent early-universe estimate of the expansion rate, and it comes out near 67 as well. The early route is not one measurement but several, and they agree with each other.
There are also methods that fit neither category. When two neutron stars merged in 2017, the gravitational waves gave the distance directly, with no ladder at all, and the host galaxy’s redshift gave the speed; the result was about 70, with large uncertainty. Chapter 16 tells that story. Distant quasars split into multiple images by a foreground galaxy show flickers that arrive in the different images at different times, and the delay depends on the distances involved; that method gives values in the low 70s. Neither is yet precise enough to settle the matter, but both are improving.
How sure is sure?
Some caution is due before declaring a crisis, because the history of the Hubble constant is a history of overconfidence.
Hubble’s own value was 500. By the 1950s it was 250, then 180, then 75. Through the 1970s and 1980s two camps, one led by Allan Sandage arguing for 50 and one led by Gérard de Vaucouleurs arguing for 100, disagreed by a factor of two, each with error bars that excluded the other, for twenty years. The truth turned out to lie between them. The people involved were skilled, careful and certain, and the certainty was the problem: each side had underestimated the ways in which its own measurements could be wrong.
Today’s disagreement is far smaller, nine per cent rather than a hundred, and the methods are far better understood. But the lesson remains. When two precise measurements disagree, the first suspect is always an error that nobody has thought of, and such errors, by definition, do not show up in the error bars. The main reason the present tension is taken seriously is that both routes have now been checked by independent methods, at both ends, and none of the checks has found a fault.
THE EQUATION — What a nine-per-cent disagreement does to the age of the universe
Chapter 6 showed that the age of the universe is roughly one divided by the Hubble constant. Turn that around: a faster expansion rate means a younger universe.
With the early-universe value of 67.4, and the standard model’s account of how the expansion rate has changed, the age comes out at 13.8 billion years. Take the local value of 73.5 instead, and keep everything else the same, and the age drops to about 12.6 billion years.
That is not an idle difference. The oldest stars in the Milky Way have been dated by the physics of how they burn their fuel at around 13 billion years, with an uncertainty of about half a billion. A universe 12.6 billion years old is uncomfortably close to being younger than some of its own stars, the same embarrassment that plagued cosmology in the 1930s. Either the local measurement is high, or the standard model’s account of the expansion history is wrong in a way that makes the universe older than a simple calculation suggests. Both possibilities are being explored.
Suspects
Suppose both measurements are right. Then the standard model is wrong somewhere, and the question is where. Because the early-universe number is a prediction that depends on the whole model, any change to the model shifts it. The physics that would be needed is fairly well understood, and it points in an awkward direction.
The size of the sound horizon, the ruler that both the microwave background and the galaxy pattern rely on, is fixed by how far sound could travel before the fog lifted. If the early universe expanded a little faster than the model assumes during that period, sound would have travelled a little less far, the ruler would be a little shorter, and everything calibrated on it would have to be a little closer, which raises the inferred expansion rate. Raise it by the right amount and the tension disappears.
Something would have to supply that extra early expansion. The best-studied proposal is early dark energy: a brief burst of an extra energy component, active for a short period before the fog lifted and fading away afterwards. It can be made to work, at the cost of adding new ingredients that exist for no other reason, and it tends to spoil the model’s fit to other data slightly. Other proposals include extra unknown particles in the early universe, a slightly different behaviour of neutrinos, or interactions between dark matter and radiation that the standard model lacks.
Alternatively the change could be late. Chapter 11’s hint that dark energy has been weakening over the past few billion years would alter the recent expansion history, but in the direction that makes the tension slightly worse rather than better, which is one reason the two puzzles are usually treated as separate. A few proposals invoke our own neighbourhood, suggesting that we live in a region of below-average density from which the local expansion appears faster than average, but the region would need to be far larger and emptier than surveys find.
The uncomfortable truth is that after a decade of effort, nobody has found a modification of the standard model that resolves the tension cleanly without breaking something else. That does not mean none exists. It means the problem is hard.
Crisis or opportunity?
Two things are true at once, and a fair account has to hold both.
The first is that the standard model is in some trouble. Its two most precise routes to its simplest number disagree, the disagreement has survived every check anyone has devised, and every proposed fix costs more than it saves. Add the hints from chapter 11 that dark energy is not constant, the thirty-year failure to find dark matter, the puzzles about early galaxies in chapter 18, and a smaller but persistent disagreement about how lumpy the universe is today compared with what the microwave background predicts, and the picture is of a theory under strain from several directions at once.
That last item deserves a sentence, because it may be related. The microwave background says how lumpy the early universe was, and the standard model predicts how much lumpier gravity should have made it since. Weak-lensing surveys, which map today’s lumpiness directly by the distortion of galaxy shapes, have tended for a decade to find the universe slightly smoother than predicted, by a couple of sigma. The effect is weaker than the Hubble tension and some recent surveys find it has faded, but it points the same way: the universe today does not look quite like the one the early universe promised.
The second is that this is what progress looks like. A model that fits everything perfectly teaches nothing new. Newton’s gravity was under strain from Mercury’s orbit for seventy years before Einstein showed why, and the answer did not discard Newton but contained him as a special case. The likeliest outcome of the Hubble tension is not that Lambda-CDM is thrown out, but that it turns out to be the low-energy, late-time approximation of something richer, and that the disagreement between 67 and 73 is the first clear glimpse of what that something is.
There is a modest Irish footnote. Ireland joined the European Southern Observatory in 2018, giving astronomers here access to the Very Large Telescope in Chile and the Extremely Large Telescope now under construction alongside it, whose thirty-nine-metre mirror will see first light around 2030. Among its tasks will be to measure distances more precisely than ever before, and Irish astronomers will be among those trying to find out which of the two roads is wrong.
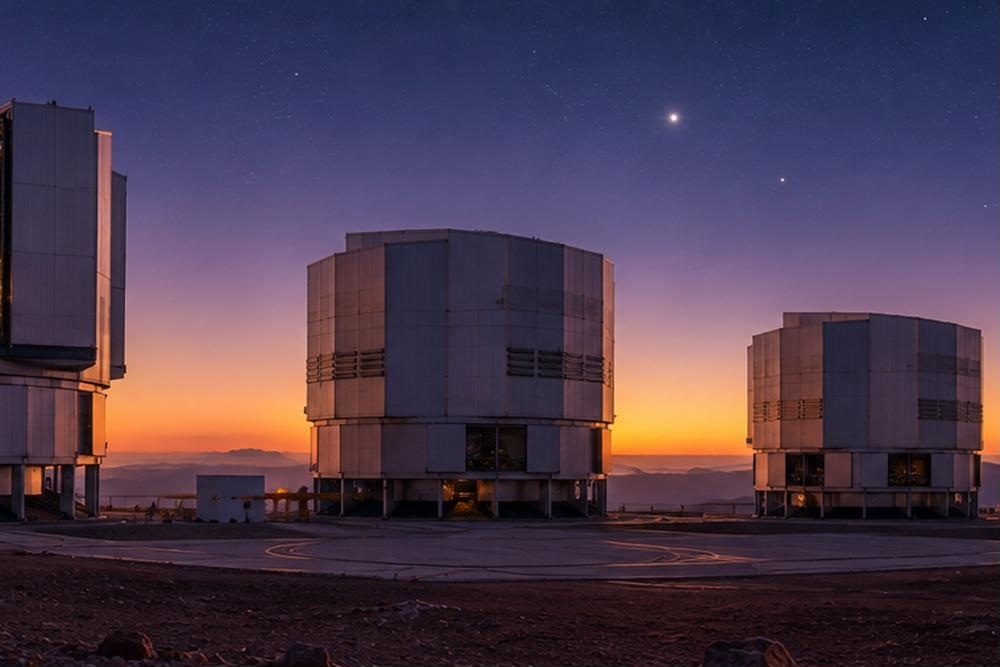
Figure F13-03. The Very Large Telescope on Cerro Paranal, Chile. Sharper distances, from instruments like these and their successors, are the surest way to find out which measurement is wrong.
Where this leaves us
The expansion rate of the universe today is either about 67 or about 73, and the two answers have each been measured to about one per cent by methods that have been checked and rechecked. They cannot both be right. Either an error remains hidden in one of the most carefully examined measurements in science, or the standard model of the universe is missing something, most likely in its first few hundred thousand years.
That is the state of the argument in the autumn of 2026, and it is only one of the arguments. The next chapter surveys the whole frontier: the instruments coming online, the puzzles that have appeared in the last few years, and the results that the field is waiting for.
Chapter 14 — The Frontier Now
“Reality must take precedence over public relations, for nature cannot be fooled.” — Richard Feynman, 1986
A report from the front line
This chapter is different from the others. The rest of the book describes things that are settled, or at least settled enough to have a shape. This one describes things that are not. It is a snapshot of cosmology as it stands in September 2026: the instruments that have just come online, the puzzles that have appeared in the last few years, and the results the field is waiting for. Some of what follows will be out of date within a year, which is exactly the point. If you are reading this some years after it was written, the most useful thing it can do is tell you what the questions were, so that you can go and find out how they turned out.
The last two chapters described a standard model under strain from several directions. This one starts with the tools being built to relieve it.
A new fleet of eyes
Cosmology has entered its most instrument-rich decade, and it is worth listing the fleet, because almost every open question below will be decided by one of these.
The James Webb Space Telescope, launched at the end of 2021, sees the infrared light of the earliest galaxies and has produced most of the surprises in this chapter. The European Euclid satellite, launched in 2023, is mapping the shapes and positions of over a billion galaxies across a third of the sky; its first year of survey data begins its public release in November 2026, with the dark-energy results following in 2027. The Dark Energy Spectroscopic Instrument, described in chapter 11, completed its planned five-year survey in the spring of 2026, has been extended to 2028, and will deliver its full analysis in 2027.
Two instruments are brand new. The Vera C. Rubin Observatory in Chile, carrying the largest digital camera ever built, with 3.2 billion pixels, issued its first public alerts on the night of 24 February 2026, some eight hundred thousand of them, flagging everything in the sky that had changed since the last visit, from asteroids to exploding stars. Its ten-year Legacy Survey of Space and Time formally began on 29 June 2026. It will photograph the entire southern sky every few nights, producing a decade-long film of the cosmos, and is expected to raise the number of known supernovae from thousands to millions.
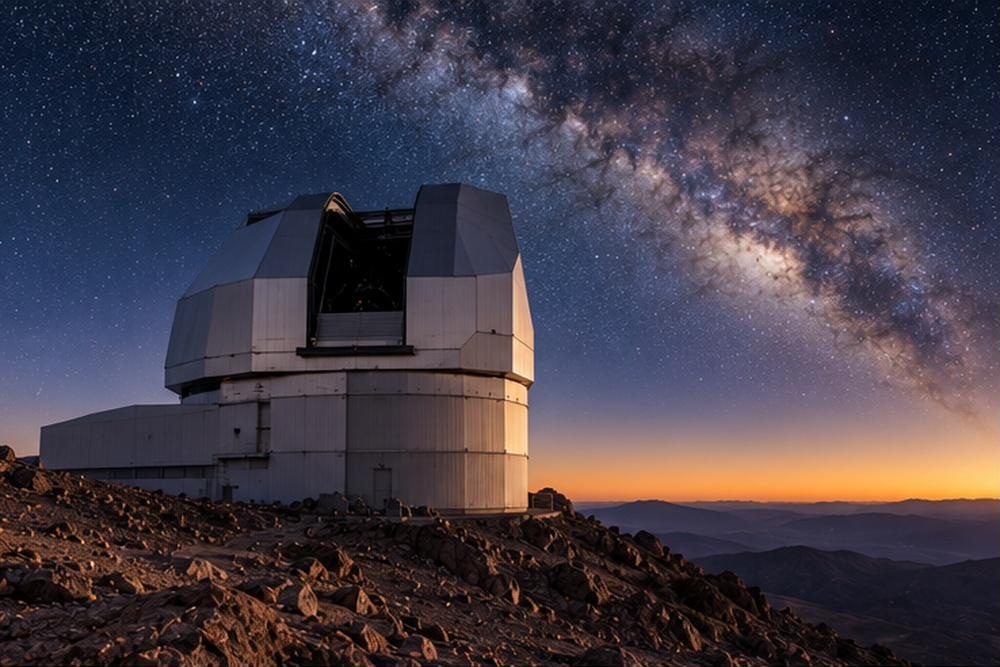
Figure F14-01. The Vera C. Rubin Observatory on Cerro Pachón. Every few nights it photographs the whole southern sky, and every night it reports millions of things that have changed.
And NASA’s Nancy Grace Roman Space Telescope, named for the astronomer who made the Hubble Space Telescope happen, was launched on 30 August 2026, three weeks before these words were written, and is on a three-month journey to its station a million and a half kilometres from Earth. Roman carries a mirror the size of Hubble’s but sees a patch of sky a hundred times larger, and it was designed from the outset to measure dark energy by every method chapter 11 described, at once.
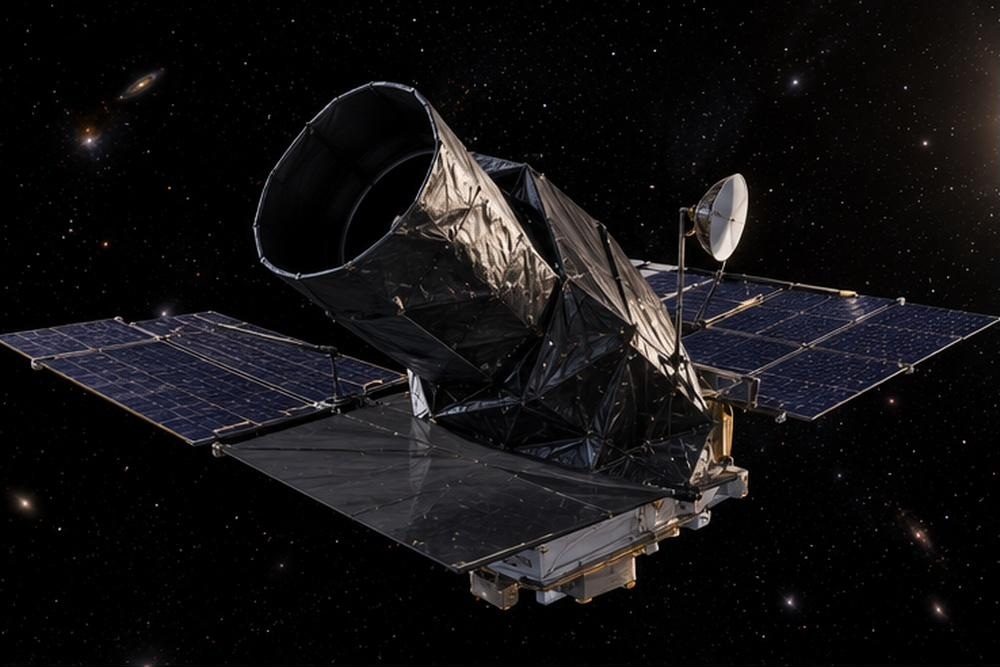
Figure F14-02. The Nancy Grace Roman Space Telescope, launched on 30 August 2026. A Hubble-sized mirror with a field of view a hundred times wider, built to settle the question of dark energy.
Further out are the Square Kilometre Array, a vast radio telescope now being built in Western Australia and South Africa; the European Extremely Large Telescope in Chile, with a mirror thirty-nine metres across, due to see first light around 2030; a Japanese-led satellite called LiteBIRD to map the polarisation of the microwave sky in the early 2030s; and, in the mid-2030s, the European space-based gravitational-wave observatory LISA, whose three spacecraft will fly in a triangle two and a half million kilometres on a side.
KEY CONCEPT — Survey astronomy
Almost every instrument on that list works differently from the telescopes of Part I. Herschel or Hubble pointed at one thing at a time and studied it. A survey instrument points at everything, systematically, and stores it all, and the science is done afterwards on the archive, often by people who never touched the telescope.
The scale is new. Rubin produces about twenty terabytes of images a night, which is roughly the text of every book in a large national library, every night, for ten years. Using the powers of ten from chapter 3, that is about 2 × 10¹³ bytes a night, and about 6 × 10¹⁶ over the survey: sixty thousand million million. No human will look at more than a tiny fraction of it. The discoveries will be made by software, and the job of the astronomer increasingly resembles that of a detective sifting evidence that a machine has already gathered.
The great advantage is fairness. A survey does not choose what to look at, so its results are not biased by what its designers found interesting. The great disadvantage is that a subtle error in the software is repeated a billion times.
Too big, too soon
JWST’s first deep images, in 2022, contained galaxies that looked too bright, too massive and too mature for the ages at which they were seen. Within a year the record for the most distant confirmed galaxy had been pushed back to about 290 million years after the beginning, a galaxy already containing hundreds of millions of stars barely two per cent of the way through cosmic history. By 2025 a galaxy was confirmed at about 280 million years. There were also far more bright galaxies at these early times than the standard picture of galaxy formation had predicted, by a factor of several.
Headlines said that JWST had broken cosmology. It had not, and it is worth being precise about why, because the episode is a good example of how a frontier result gets digested.
The standard model of the universe, Lambda-CDM, predicts how much dark matter had gathered into clumps by any given time, and that prediction is not in trouble. What it does not predict, on its own, is how efficiently the ordinary gas in those clumps turns into stars, which depends on messy physics: how gas cools, how quickly stars form, how much the first supernovae blow the remaining gas away, how much dust hides the light. The early galaxies are too bright for the assumptions astronomers used to make about that messy physics. They are not too massive for the dark-matter framework to hold them.
So the puzzle has moved, from cosmology to astrophysics. The leading ideas are that star formation in the first few hundred million years was unusually efficient, or came in violent bursts that made galaxies briefly far brighter than their average, or produced more massive stars than today, or that the earliest galaxies had less dust than expected and so hid less of their light. Any or all of these could be true, and the question is being attacked by taking JWST spectra of hundreds of early galaxies to measure their ages, chemistry and star-formation rates one by one.
The little red dots
The strangest of JWST’s discoveries was not predicted by anybody, and in 2026 it appears to be on the way to a solution.
Scattered across JWST’s deep images were hundreds of tiny, compact, intensely red points of light at great distances, quickly nicknamed the little red dots. They had the spectral signature of gas moving at enormous speeds, which usually means a black hole, but they were oddly faint in X-rays, which black holes usually produce, and if their black holes were as massive as the usual methods suggested they would be absurdly large for their host galaxies, making up a tenth or more of the galaxy’s mass rather than the usual tenth of a per cent.
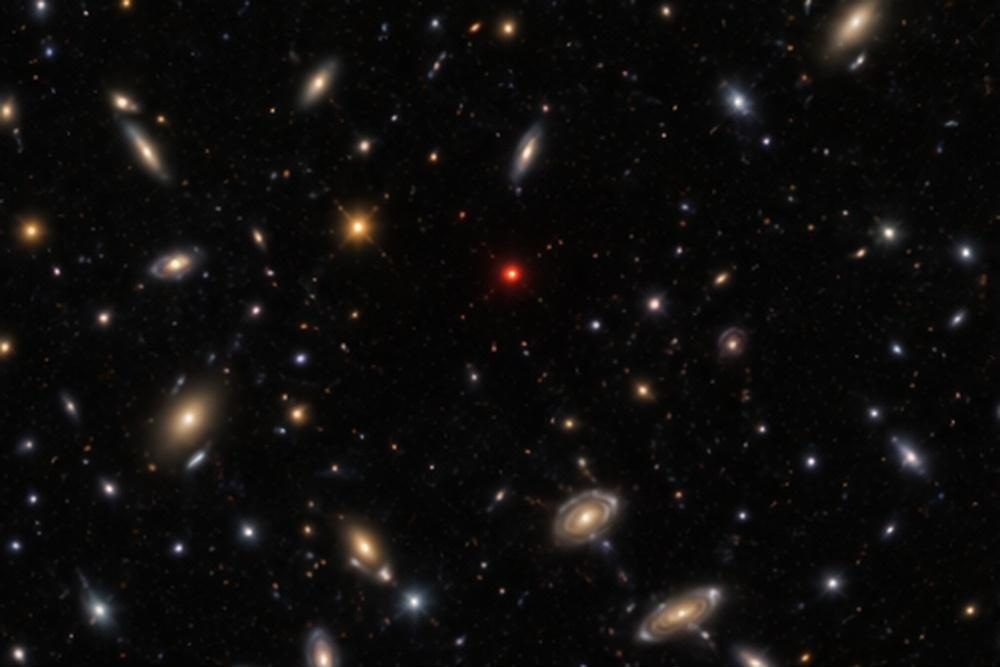
Figure F14-03. A little red dot. Hundreds of these compact red objects turned up in JWST’s images of the early universe, and nobody had predicted them.
Over 2025 and 2026 a picture has emerged. Analysis of the highest-quality spectra, published in January 2026, showed that the broad lines could be produced not by fast-moving gas but by light scattering off electrons in a dense envelope, which meant the black-hole masses had been overestimated by up to a hundred times, removing most of the “too massive” problem. In August 2026 a team reported one exceptionally bright example, at about 800 million years after the beginning, whose light was best explained by a black hole of about a hundred thousand solar masses wrapped in a dense cocoon of hydrogen the size of the solar system, glowing like the surface of a colossal star. They called it a black hole star. A detailed spectrum of another, magnified by gravitational lensing and published in June 2026, supported the same model with more than forty spectral lines. And an X-ray detection at the position of one dot, reported in the spring, matched what such an object should emit.
The emerging consensus, then, is that the little red dots are young black holes in the act of growing, swaddled in gas that reddens and reshapes their light, and that they may be the long-sought answer to how the giant black holes of the early quasars grew so fast. Chapter 17 takes this up. The consensus is not unanimous: a pair of papers in August 2026 argued that the dots could instead be single supermassive stars, a hundred thousand times the mass of the Sun, pulsating on the edge of blowing themselves apart. Both models make predictions that JWST can test, and this is exactly the state in which a frontier problem should be found, two years after discovery.
Weighing the ghost particle
A quieter puzzle has been growing in the background, and it may turn out to be connected to dark energy.
Chapter 8 mentioned that the universe is full of relic neutrinos, and that their combined gravity slightly smooths the growth of cosmic structure. The size of that effect depends on how much a neutrino weighs, so cosmology can weigh the neutrino by measuring how lumpy the universe is compared with how lumpy the microwave background says it should have become. Particle physics, from its side, knows from the way neutrinos change type as they travel that the three kinds must have a combined mass of at least about 0.06 electronvolts, a floor set by experiment.
The cosmological measurement has been tightening for years, and in 2024 and 2025, combining DESI’s galaxy map with the microwave background, it dropped below the floor. Taken at face value, the standard model prefers a neutrino mass of zero, or even, if the mathematics is allowed to run that way, a negative value, which is physically meaningless. The disagreement with the laboratory floor is at about two to three sigma.
Something is wrong, and there are three candidates. The cosmological analysis may contain a subtle error, and one much-discussed suspect is the measure of how much light was scattered by the gas of the reionised universe, a number that is hard to pin down and that shifts the answer. Or the neutrino result may be a symptom of the same illness as the dark-energy hints: if dark energy has been evolving rather than constant, the preference for negative masses disappears and the neutrino comes out comfortably positive. Or it is a fluke. Several groups reported in 2026 that models in which dark energy changes in particular ways resolve the neutrino problem and the DESI hints together, which is either a clue or a coincidence. The five-year DESI analysis in 2027 should say which.
The gravitational-wave era
Chapter 17 will tell the story of the first detection of gravitational waves in 2015. A decade on, the field has changed character. The LIGO, Virgo and KAGRA detectors finished their fourth observing run in November 2025, and the catalogue published in May 2026 lists 390 confirmed detections, almost all of them pairs of black holes spiralling together, along with a handful of neutron-star pairs and mixed pairs. A detection that was once a global news event now arrives every couple of days.
With hundreds of events, the questions have changed from “does this exist?” to statistics. How are black-hole masses distributed, and what does that say about the stars that made them? Do the two black holes in a pair spin in line with each other, which would mean they were born together, or at random, which would mean they found each other later in a crowded cluster? How many are there, and do they contribute to the dark matter? A fifth observing run, with improved detectors, is planned for around 2028, and the next generation, the Einstein Telescope in Europe and Cosmic Explorer in the United States, are being designed for the 2030s.
Meanwhile a second window opened in 2023, at frequencies a million times lower. Pulsar timing arrays, described in chapter 16, reported a background hum of gravitational waves washing across the galaxy, most likely from thousands of pairs of supermassive black holes in the centres of merging galaxies, orbiting each other over years. The evidence was at about three to four sigma. Combined data from the international collaborations are expected to settle it, and the Square Kilometre Array, when it comes online later in the decade, will be the most sensitive instrument ever built for this purpose.
Listening to the dark ages
Chapter 8 left one era of cosmic history almost blank: the dark ages, between the release of the microwave background and the first stars, when the universe contained nothing that shone. There is one way to see it. Cold hydrogen gas emits radio waves at a wavelength of 21 centimetres, and the dark ages were full of cold hydrogen. Stretched by the expansion, that signal should arrive today at wavelengths of a few metres, as a faint dip in the radio sky against the microwave background, at a level of about one part in ten thousand of the glow of our own galaxy at those wavelengths.
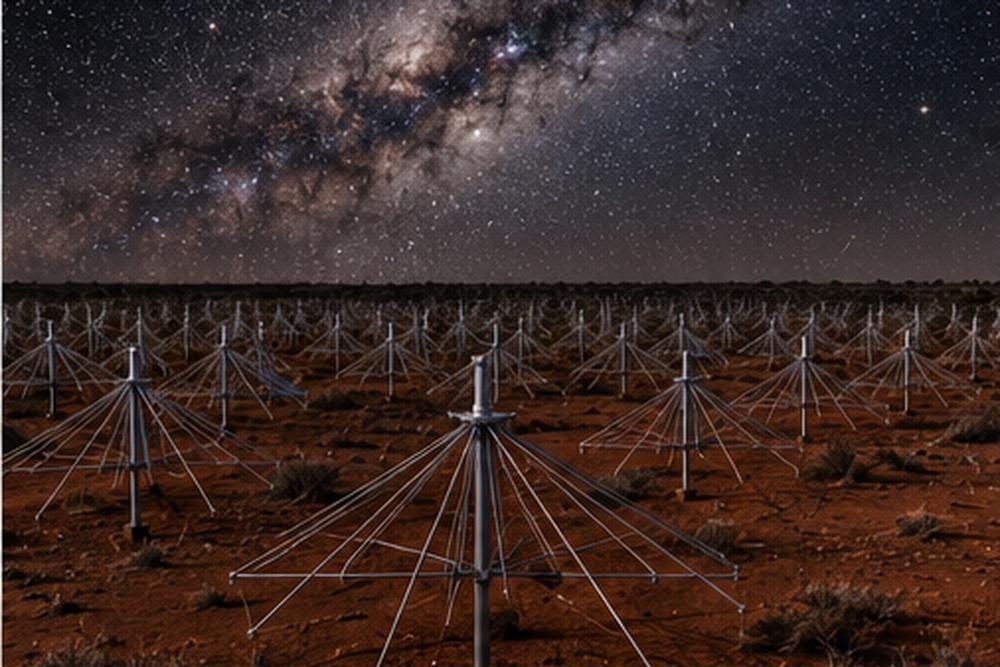
Figure F14-04. Low-frequency radio antennas in the Australian outback. Instruments like these are hunting for the faint whisper of hydrogen from the cosmic dark ages, before the first stars.
A small experiment in Western Australia claimed in 2018 to have found the signal, and found it far stronger than expected, which would have implied that the early gas was colder than it should have been or that the radio background was brighter, either of which would have required new physics. A rival experiment in India found no such signal in 2022, and most cosmologists now regard the original claim as unconfirmed. Larger arrays in South Africa and Australia have set limits that rule out the more extreme possibilities. The first stage of the Square Kilometre Array’s low-frequency telescope, tens of thousands of antennas across the Australian desert, is designed to map this signal in detail, and its first science is expected before the end of the decade. If it succeeds, it will open a window on an era that no other instrument can see.
The fingerprint of inflation
Chapter 12 described the search for the swirl in the polarisation of the microwave background that would be the fingerprint of gravitational waves from inflation, and the false alarm of 2014. The search has continued more quietly since. The South Pole experiments, combined with Planck’s dust maps, have pushed the limit on the signal down to about a fifth of what was claimed in 2014, and no swirl has been found. The Simons Observatory in Chile began observing in 2024, and its full array should reach several times deeper by the end of the decade; LiteBIRD, in the 2030s, will search the whole sky. The simplest models of inflation predict a signal within reach of these instruments. If it is not found, those models will be ruled out, and the more complicated survivors will be harder to test.
How cosmology is done now
A reader who has followed this book from Newgrange to Roman may have noticed that the cast has changed. Part I was full of individuals: Tycho, Kepler, Herschel, Leavitt, Hubble. This chapter has been full of acronyms. That is not a failure of storytelling; it is how the subject now works, and it is worth describing.
The DESI collaboration has about nine hundred members; Euclid has over two thousand; the gravitational-wave collaborations, similar numbers. A single result paper may have hundreds of authors, listed alphabetically. Nobody in a project of that size sees the whole of it, and the organisation of the work, with its committees, internal reviews and data-release schedules, resembles a large engineering company more than the Mount Wilson of 1929.
One consequence is a technique called blind analysis, and it addresses a danger this book has met repeatedly, from van Maanen’s rotating spirals in chapter 5 to the dust of 2014. Scientists who know what answer they expect, or hope for, tend to find it, not through dishonesty but through hundreds of small judgements that lean the same way. So the major surveys now hide the answer from themselves. DESI’s cosmological parameters were scrambled by a secret offset while the analysis was developed and every choice was frozen; only when the collaboration voted that the pipeline was finished was the offset removed and the true result seen, by everyone at once. The dark-energy hints of 2024 and 2025 emerged this way, which is one reason they are taken seriously.

Figure F14-05. Where the discoveries are made. Modern cosmology is done in data centres, on archives too large for any human to inspect, with the answer hidden from the analysts until the analysis is finished.
A second consequence is that machine learning has become ordinary. Software classifies galaxies, finds supernovae in the nightly stream, spots gravitational-lens arcs, and removes the Milky Way’s foreground glow from microwave maps. The Euclid consortium’s first data release in 2025 included a catalogue of 380,000 galaxies classified by a neural network that had been trained on the judgements of volunteers, members of the public who had sorted galaxy images through a website called Galaxy Zoo. Citizen scientists, in other words, taught the machine, and the machine did the rest.
A third consequence is openness. Nearly all of the data described in this chapter is public, usually within a year or two of being taken, and the analysis software is generally published with it. Anyone with a laptop can download DESI’s galaxy map or Planck’s microwave sky and check the collaborations’ work, and people do.
What to watch for next
Here, in rough order of expected arrival, are the results that will decide the questions raised in Part II.
- Late 2026: Euclid’s first survey data release begins, and Roman reaches its station and starts commissioning.
- 2027: DESI’s full five-year analysis, the single most anticipated result in cosmology: whether the hint that dark energy is weakening reaches the level of discovery. Euclid’s first dark-energy analysis. Roman’s first science. Rubin’s first full year of supernovae.
- 2027 to 2028: the final results of the current generation of dark-matter detectors, and the fifth gravitational-wave observing run.
- Late decade: the Simons Observatory’s deep search for inflation’s fingerprint; the Square Kilometre Array’s first maps of the dark ages; the Extremely Large Telescope’s first light.
- 2030s: LiteBIRD, the Einstein Telescope, Cosmic Explorer and LISA.
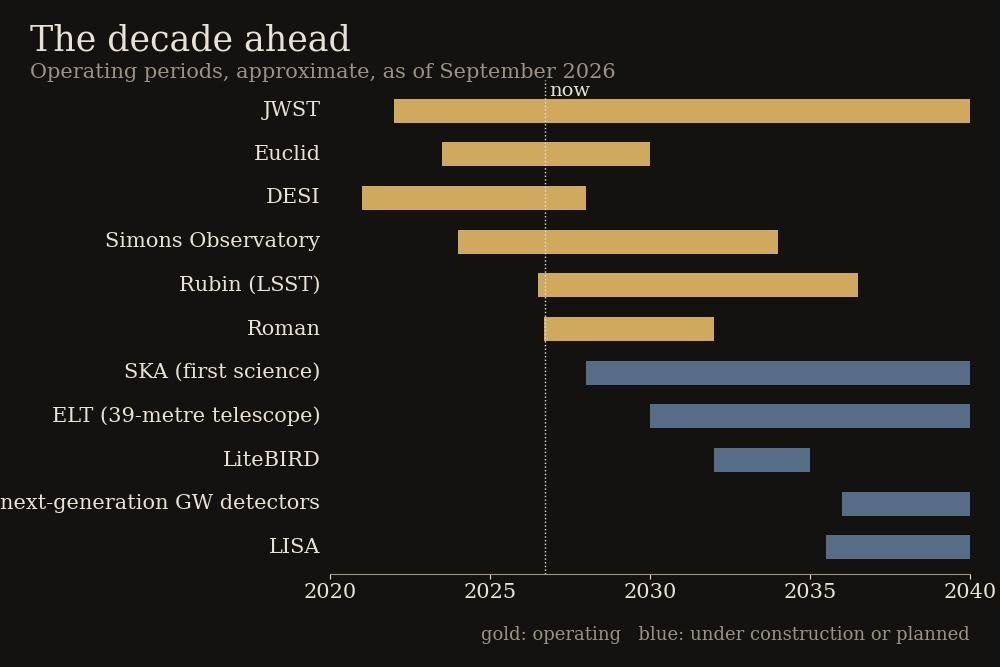
Figure F14-06. The decade ahead. The instruments now operating or under construction, and when their main results are expected.
If dark energy turns out to be weakening, the fate of the universe changes, as chapter 21 describes, and the search for what dark energy is begins in earnest. If the Hubble tension survives everything, the early universe contained something not in the standard model. If the inflationary swirl is found, the earliest instant will have been measured; if it is not, the theory of that instant will need rethinking. If the neutrino puzzle persists, it will point the same way as the dark-energy hints. And if a dark-matter particle is finally caught in a tank of xenon under a mountain, a quarter of the universe will have a name.
Where this leaves us
Part II set out the standard model of the universe and the evidence for it, and ended with the places where it is under strain. It is a strange and exciting moment. The model fits a hundred observations, and yet its two dominant ingredients are unidentified, its expansion rate is disputed, its dark energy may not be constant, and its earliest galaxies formed faster than expected. A decade from now, either the model will have been quietly confirmed by the best data ever taken, or something new will have been found. Either would be a good outcome, and it is not often that a science can say that both of its possible futures are worth living through.
Part III leaves the universe as a whole and turns to the things in it: stars, the dead stars that will not lie still, black holes, galaxies, and the worlds around other suns. These are where the universe becomes interesting rather than merely large, and where the questions people actually ask, what is out there, what is it like, and is anyone else looking back, begin to have answers.
Part III — The Cosmic Menagerie
Chapter 15 — The Lives of Stars
“We are made of star-stuff.” — Carl Sagan, 1973
Nurseries of gas and dust
Part III leaves the universe as a whole and turns to the things in it, beginning with the objects that make everything else visible.
A star begins as a cloud of cold gas, mostly hydrogen, drifting between the stars of a galaxy. These clouds are enormous, tens of light-years across and containing enough material for thousands of suns, and they are thin: a good laboratory vacuum on Earth is denser. They are also cold, a few tens of degrees above absolute zero, and they contain a small admixture of dust, grains of carbon and silicate about the size of smoke particles, made in the deaths of earlier stars.
Such a cloud sits in a balance. Its own gravity pulls it inwards; the motion of its molecules, its magnetic fields and the pressure of starlight hold it up. Disturb the balance, by a passing shockwave from a nearby exploding star, or by the cloud drifting through the crowded arm of a spiral galaxy, and parts of it begin to collapse.
Once collapse starts, it runs away. A denser clump pulls harder, so it gathers more material, so it becomes denser. The cloud fragments into hundreds or thousands of separate collapsing cores, which is why stars are almost always born in groups. The Sun had siblings, scattered long ago around the galaxy.
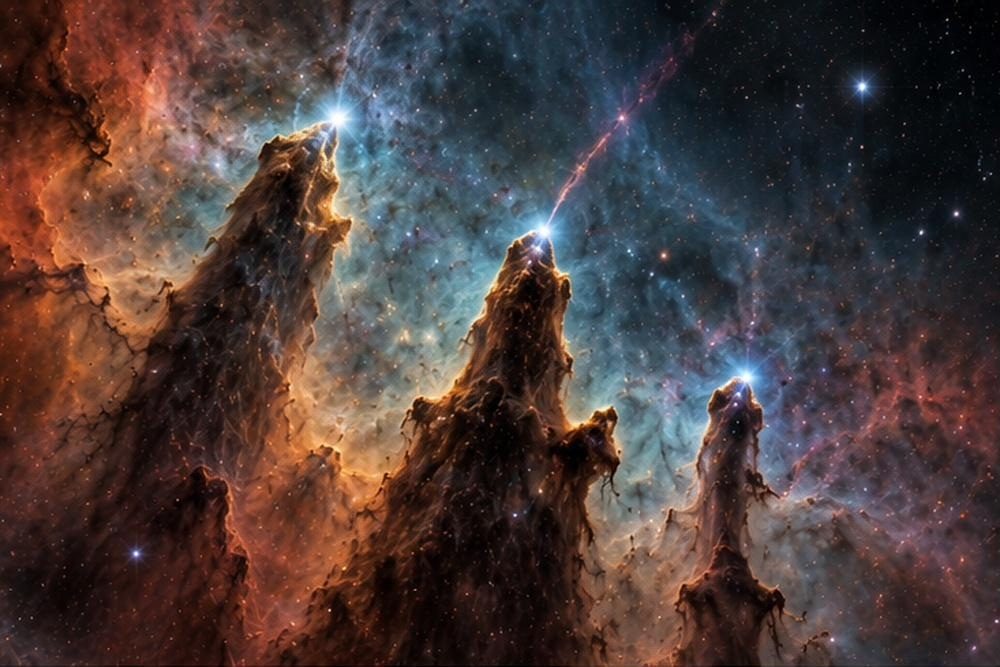
Figure F15-01. A star-forming region. Dense columns of gas and dust, sculpted by the radiation of stars already born, with new ones condensing inside them.
As a core collapses it heats up, because the gas falling inwards converts gravitational energy into motion, and motion is heat. It also spins faster, for the same reason a skater spins faster when pulling in her arms, and the spin flattens the infalling material into a disc around the central lump. Any planets will form later in that disc, as chapter 19 describes.
The centre gets hotter and denser until, at about ten million degrees, something new begins. Hydrogen nuclei, which repel each other fiercely because they all carry positive charge, are moving fast enough and are packed closely enough to occasionally fuse together into helium. The energy released is enormous, and it flows outward as light and heat. The collapse stops. A star has been born.
The balancing act
A star spends most of its life in a stalemate, and understanding that stalemate explains almost everything else about stars.
Gravity is always pulling the star’s material inwards, and it never rests. Fusion in the core produces heat, and the resulting pressure pushes outwards. When the two balance exactly, the star holds a steady size. This balance is not delicate: it is self-correcting, which is why stars are stable for billions of years. Squeeze a star slightly and the core heats up, fusion speeds up sharply, pressure rises and pushes it back out. Let it expand slightly and the core cools, fusion slows, and gravity pulls it back. The star is its own thermostat.
THE EQUATION — E = mc², and what the Sun spends
Fusing hydrogen into helium releases energy because the helium nucleus weighs slightly less than the four hydrogen nuclei that went into it, by about seven parts in a thousand. The missing mass becomes energy, in the amount Einstein’s equation gives: energy equals mass multiplied by the speed of light multiplied by the speed of light again.
The speed of light is 300,000,000 metres per second, so multiplying by it twice gives a factor of 9 × 10¹⁶. A single gram of matter, entirely converted, would release about 90 million million joules, roughly the energy of twenty thousand tonnes of TNT.
The Sun radiates 3.8 × 10²⁶ joules every second. Dividing one by the other, it must be converting about four million tonnes of its own mass into energy every second, which it has been doing for 4.6 billion years. That sounds ruinous, but the Sun weighs 2 × 10²⁷ tonnes, and in its whole lifetime it will lose less than a tenth of one per cent of its mass this way. The fuel limit is not the mass converted but the hydrogen available in the hot core, which is about a tenth of the star.
Because fusion is so extraordinarily efficient, stars last a long time. The Sun has been shining for 4.6 billion years and has about five billion left.
There is one more thing to know about the balance: it depends on mass, and almost nothing else. A star ten times heavier than the Sun has ten times the weight pressing on its core, so the core must be far hotter and denser to hold it up, so fusion runs far faster. Such a star is thousands of times more luminous, and burns through its fuel in tens of millions of years rather than billions. Conversely a star a tenth of the Sun’s mass is dim, cool and frugal, and will shine for trillions of years, far longer than the present age of the universe. Every red dwarf ever born is still burning.
This is the single most useful fact in stellar astronomy: mass determines everything. How bright a star is, what colour it shines, how long it lives and how it dies all follow from how much material it gathered at birth.
A map of stellar lives
Around 1910, working independently, the Danish astronomer Ejnar Hertzsprung and the American Henry Norris Russell each had the idea of plotting stars on a graph, with their true brightness up the side and their colour, which chapter 4 showed is a measure of temperature, along the bottom.
The result was not a random scatter. Nearly all stars fall on a single diagonal band running from hot, blue, brilliant stars at one end to cool, red, dim ones at the other. This band is called the main sequence, and it is simply the line of stars that are fusing hydrogen in their cores, arranged in order of mass: the heavy ones hot and bright at the top, the light ones cool and dim at the bottom. About nine stars in ten, including the Sun, are on it at any moment.
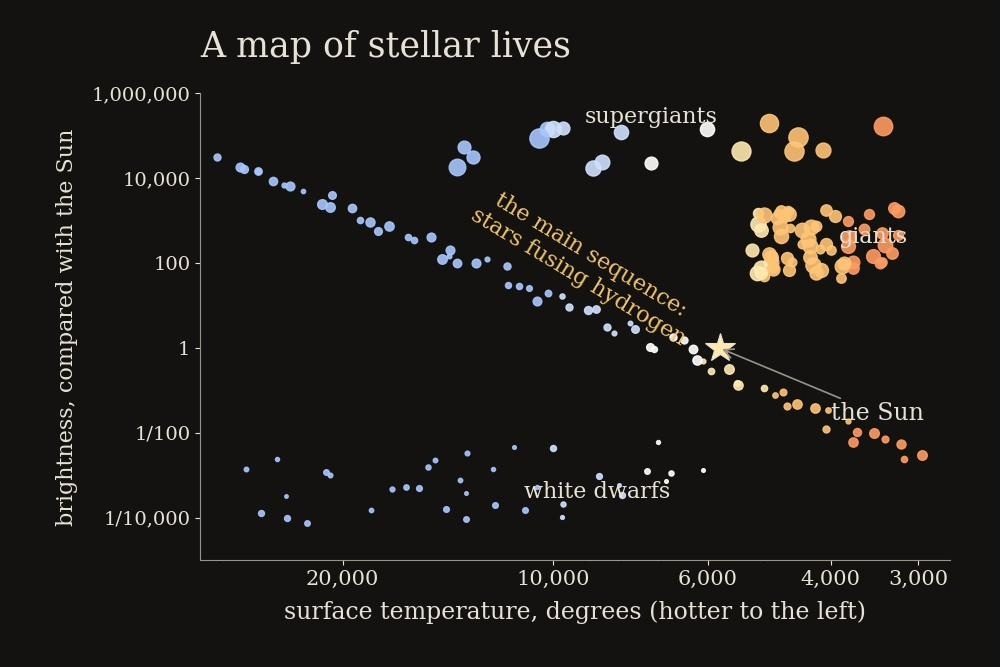
Figure F15-02. The Hertzsprung–Russell diagram, the single most useful graph in astronomy. Stars fusing hydrogen lie on the diagonal main sequence; the giants above and the white dwarfs below are stars in the process of dying.
Two other groups sit off the band. Up and to the right are stars that are cool and red yet extremely bright, which can only mean they are enormous: the giants and supergiants. Down and to the left are stars that are hot and white yet very dim, which can only mean they are tiny: the white dwarfs. Neither group is a different kind of star. They are ordinary stars at later stages of life, and the diagram, read properly, is a map of how stars age.
How a Sun-like star dies
Follow the Sun forward. In about five billion years the hydrogen in its core will run out, leaving a core of helium that is not yet hot enough to fuse. Without fusion, the core has no way to hold itself up, and it contracts. Contraction heats it, and the heat ignites hydrogen fusion in a shell around the core, which burns fiercely.
The effect on the outer layers is dramatic and counter-intuitive: the star swells. The extra energy from the shell pushes the surface outwards until the Sun is perhaps a hundred times its present diameter, engulfing Mercury and Venus and leaving the Earth scorched and probably swallowed. The expanded surface is spread over a vast area, so it cools to a dull orange. The Sun will have become a red giant.
Meanwhile the helium core contracts further until it reaches a hundred million degrees, at which point helium itself begins to fuse into carbon and oxygen, through the three-body process that Hoyle worked out in chapter 7. This buys a few hundred million years. When the helium runs out, the core contracts again, but the Sun is not massive enough to reach the temperature needed to fuse carbon, and the story ends there.
What follows is gentle. The outer layers, only loosely held, drift away in a series of pulses, exposing the intensely hot core, whose ultraviolet light makes the escaping gas glow in intricate shells and rings. These are the objects that Herschel misnamed planetary nebulae, because in a small telescope they look like the discs of planets; they have nothing to do with planets. They are beautiful, and they are brief, lasting a few tens of thousands of years before the gas disperses.
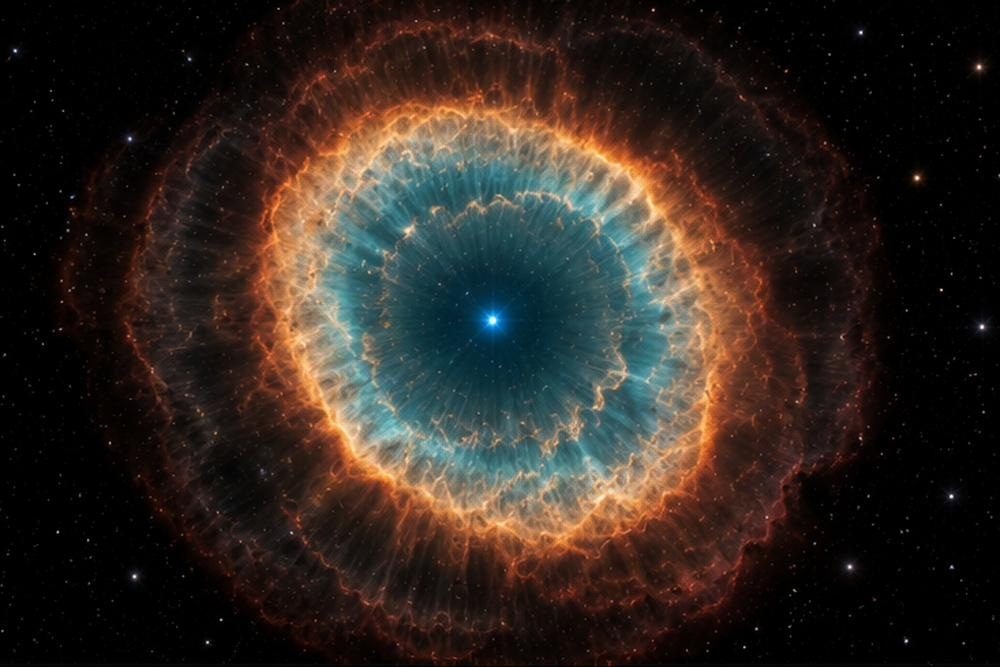
Figure F15-03. A planetary nebula: the shed outer layers of a dying star like the Sun, lit by the exposed core at its centre. In a few tens of thousands of years it will have dispersed.
Chandrasekhar’s limit
What is left is the naked core: a ball of carbon and oxygen about the size of the Earth containing about half the mass of the Sun. This is a white dwarf, and it is one of the strangest objects in nature.
Nothing is burning in it. There is no fusion, no energy source at all. It does not collapse because of a quantum effect that has nothing to do with heat: electrons refuse to occupy the same state as one another, and when matter is squeezed hard enough this refusal produces a pressure that resists further compression, no matter how cold the material gets. The companion volume explains the underlying physics. Here, the point is that a white dwarf is held up by a rule about electrons rather than by heat, and it simply sits there, slowly radiating away its leftover warmth over billions of years.
A teaspoon of white dwarf weighs about five tonnes.
In 1930, a nineteen-year-old Indian student named Subrahmanyan Chandrasekhar worked out, on a long ship voyage to England, that this support has a limit. The more massive a white dwarf, the more strongly gravity squeezes it, the faster its electrons must move to resist, and eventually they approach the speed of light and can push no harder. Above about 1.4 times the mass of the Sun, no white dwarf can exist at all.
When he presented this in London in 1935, the most eminent astrophysicist of the day, Arthur Eddington, ridiculed it publicly, saying that there must be a law of nature to prevent a star behaving in such an absurd way. Chandrasekhar, humiliated, moved to America and worked on other things for decades. He was right, and received the Nobel Prize for it in 1983, nearly fifty years later.
The Chandrasekhar limit matters far beyond the stars. It is the limit chapter 11 relied on: a white dwarf pushed over it by stealing gas from a companion detonates as a Type Ia supernova, always at the same mass, therefore always about the same brightness, which is what made the discovery of dark energy possible.
The onion and the collapse
Now follow a star ten or twenty times the mass of the Sun, and everything happens faster and ends violently.
Such a star burns hydrogen in a few tens of millions of years, then helium, and because its core can reach far higher temperatures, it does not stop there. Carbon fuses to neon and magnesium, neon to oxygen, oxygen to silicon, silicon to iron. Each stage takes place in a hotter, denser shell closer to the centre, and each is faster than the last: carbon burning lasts centuries, oxygen burning about a year, silicon burning a single day.
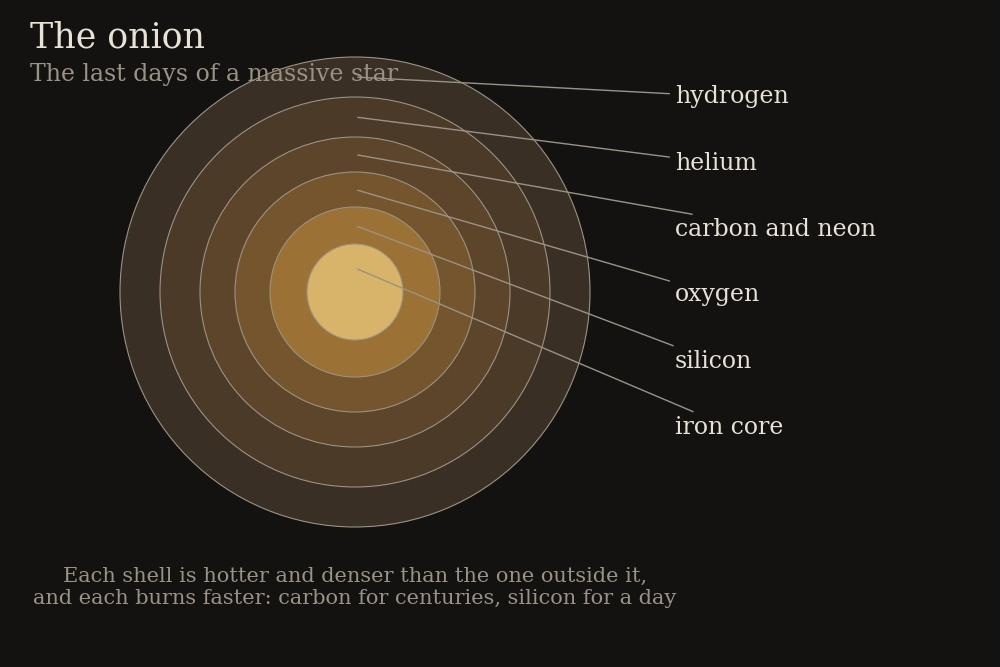
Figure F15-04. The onion. In its last days a massive star fuses successively heavier elements in nested shells, building up to an iron core that cannot burn.
At iron, fusion stops, and the reason is fundamental. Fusing light elements releases energy; fusing elements heavier than iron consumes it. Iron is the bottom of the energy valley, the most tightly bound nucleus there is. An iron core produces no heat, so it cannot hold itself up, and it grows until it exceeds the Chandrasekhar limit.
Then, in less than a second, the core collapses. Electrons are crushed into protons to make neutrons, releasing a flood of neutrinos. The core, now a ball of neutrons about twenty kilometres across, is brought up short as the neutrons themselves refuse to be compressed further, and the infalling outer layers, arriving at a quarter of the speed of light, bounce off it. That rebound, helped along by the neutrinos, blows the star apart.
This is a core-collapse supernova. For a few weeks it shines with the light of a billion Suns, briefly outshining its entire galaxy. The energy released in a few seconds exceeds everything the star produced in its whole previous lifetime, and ninety-nine per cent of it is carried away invisibly by the neutrinos.
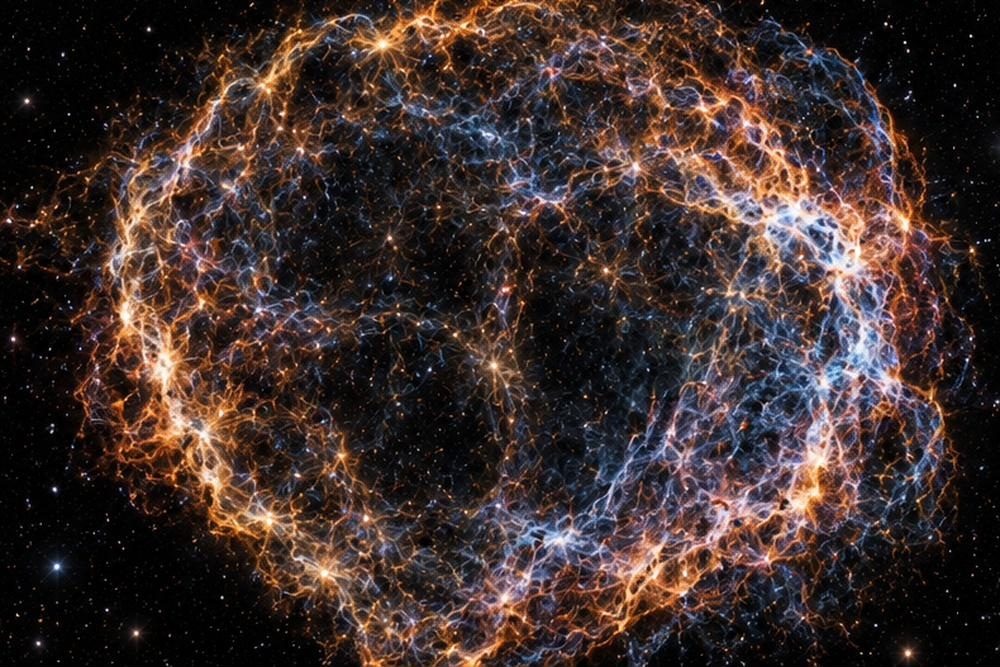
Figure F15-05. A supernova remnant, centuries after the explosion. The filaments are the star’s outer layers still expanding into space, enriched with the elements it made.
Supernova 1987A
On 23 February 1987, a star exploded in the Large Magellanic Cloud, 160,000 light-years away, and for the first time since the invention of the telescope a supernova was close enough to study in detail. Within days it was visible to the naked eye.
The most remarkable part happened before anyone saw it. About three hours before the light arrived, three neutrino detectors around the world, built to look for entirely different things, registered a burst of about two dozen neutrinos within a few seconds of each other. That handful of particles confirmed the whole theory of core collapse. The neutrinos arrived first because they escape the collapsing core immediately, while the light has to fight its way out through the star’s outer layers.
Astronomers have watched the remnant expand ever since, and in 2024 JWST found the signature of a compact object at its centre, almost certainly the neutron star that the theory predicted would be left behind.
Star-stuff
Chapter 7 described the argument over where the elements came from, and its resolution: the lightest in the first minutes of the universe, the rest in stars. Here is the accounting, as it is now understood.
Hydrogen and most helium came from the Big Bang. Carbon, nitrogen and oxygen are made mostly in stars of moderate mass and released gently in planetary nebulae. Elements up to iron are made in the cores of massive stars and scattered by core-collapse supernovae. Iron itself comes substantially from Type Ia supernovae, the exploding white dwarfs. Roughly half the elements heavier than iron are built slowly inside aged giant stars, by nuclei quietly absorbing stray neutrons one at a time; the other half, including most of the gold, platinum and uranium, is made in seconds, in the violence of colliding neutron stars, a story that belongs to the next chapter.
KEY CONCEPT — Where you came from
This is not a metaphor, and it is worth stating plainly. Every atom in your body heavier than hydrogen was manufactured inside a star that died before the Sun existed.
The hydrogen in your water is 13.8 billion years old and was made in the first minutes of the universe. The carbon in your cells and the oxygen you are breathing were made in the cores of stars and blown into space when those stars died. The calcium in your bones and the iron in your blood were forged in the last moments of massive stars or in the detonation of white dwarfs. The traces of iodine in your thyroid, and any gold you are wearing, were most likely made in the collision of two neutron stars.
All of it drifted for a long time in interstellar clouds, was swept up into the cloud that collapsed to make the Sun and its planets 4.6 billion years ago, and was eventually incorporated into a biosphere. The atoms in your left hand and your right hand may well have been made in different stars. It is, on the evidence, the literal truth that people are made of the remains of stars, and it took the whole history in this book to find it out.
Öpik at Armagh
One strand of this story runs through Ireland. Ernst Öpik, an Estonian astronomer, spent the Second World War years moving between occupying armies and arrived in Northern Ireland in 1948, where he worked at Armagh Observatory for the next thirty-three years.
In 1938, working in Tartu, he had published a calculation of what happens inside an ageing star when the hydrogen in its core runs out. His answer was that the core contracts and the outer layers swell enormously, turning the star into a red giant. It was the first correct account of the process described earlier in this chapter, and it was published in an obscure Estonian journal and largely overlooked; the same result was found independently a few years later by others and is often credited to them. Öpik also devised, independently of Jan Oort, the idea of a vast cloud of comets surrounding the solar system, now usually called the Öpik–Oort cloud, and worked out a method for calculating collision probabilities between orbiting bodies that is still used for assessing the risk from asteroids.
He was, by all accounts, a formidable and eccentric presence at Armagh, where he also edited the Irish Astronomical Journal for many years. It is a reminder that in the middle of the twentieth century, significant work on the lives of stars was being done in a small observatory in County Armagh.
How stars are weighed and watched
A fair question at this point is how anyone knows all this, given that no star can be visited, dissected or watched from birth to death.
Four things make it possible. First, there are a great many stars, so instead of following one star through its life, astronomers look at populations, and see stars of all masses at all stages at once. A star cluster is especially useful, because all its stars formed at about the same time from the same material and differ mainly in mass; plotting a cluster on the Hertzsprung–Russell diagram shows the heaviest stars already leaving the main sequence while the lighter ones remain, and where the bend occurs gives the cluster’s age. That is how the ages of the oldest stars in the galaxy, which chapter 13 compared with the age of the universe, are measured.
Second, double stars give masses, as chapter 4 explained, which is what anchors the claim that mass determines everything.
Third, the physics can be computed. A star is a ball of gas obeying gravity, thermodynamics and nuclear physics, all of which are known, and computer models of stellar interiors have been refined for seventy years. They reproduce the observed relationship between mass, brightness and colour with precision.
Fourth, the interiors can be checked directly, by two remarkable methods. Stars ring: their surfaces oscillate in a pattern of standing waves, like the ringing of a bell, and measuring those oscillations reveals the structure inside, in the same way that seismology reveals the interior of the Earth. Space telescopes have done this for hundreds of thousands of stars. And the Sun’s core can be inspected directly, because the neutrinos produced by fusion escape immediately and pass straight through the Earth; detectors have counted them and found the number the theory predicts, which means the Sun’s central furnace is understood.
Where this leaves us
Stars are simple objects, in the end. A ball of gas held up against its own gravity by the heat of nuclear fusion, whose whole life story is dictated by how much it weighs. Light ones are dim and effectively immortal; middling ones swell, shed their outer layers and leave an Earth-sized ember; heavy ones build the periodic table in nested shells and then destroy themselves, scattering their work into space.
What that violence leaves behind is the subject of the next two chapters, and it is where the universe stops being reasonable. A neutron star packs the mass of the Sun into the size of a city, spins hundreds of times a second and keeps time better than an atomic clock. And if the collapsing core is heavy enough, nothing at all stops it.
Chapter 16 — Dead Stars That Won’t Lie Still
“We are all in the gutter, but some of us are looking at the stars.” — Oscar Wilde, 1892
A bit of scruff
In 1967 a twenty-four-year-old graduate student from Lurgan in County Armagh spent two years helping to build a radio telescope in a field outside Cambridge: 2,048 aerials strung between more than a thousand wooden posts across two hectares, wired together with 190 kilometres of cable. Jocelyn Bell had swung a sledgehammer with the rest of the team. When it was finished, operating it was her job, and so was reading the output, which arrived as a pen trace on a roll of chart paper at about thirty metres a day.
The telescope was built to study quasars, using the way their radio signals twinkle as they pass through the gusty solar wind, in the same way that starlight twinkles through the Earth’s atmosphere. Bell had to scan the paper by eye, and within a few weeks she could tell the difference between a genuine twinkling source, a passing aircraft, a badly suppressed television set and a faulty thermostat.
In August 1967 she noticed something that fitted none of those categories, occupying about a centimetre of the chart, which she later described as a bit of scruff. It came from the same patch of sky each time, which ruled out terrestrial interference, and it appeared at night, when the twinkling from the solar wind should be weakest.
She persuaded her supervisor, Antony Hewish, to let her run the chart recorder faster when that patch of sky came round, which meant waiting several weeks for the trace to show anything at all. Then, on 28 November 1967, it resolved into a series of sharp pulses, one every one and a third seconds, as regular as a metronome.
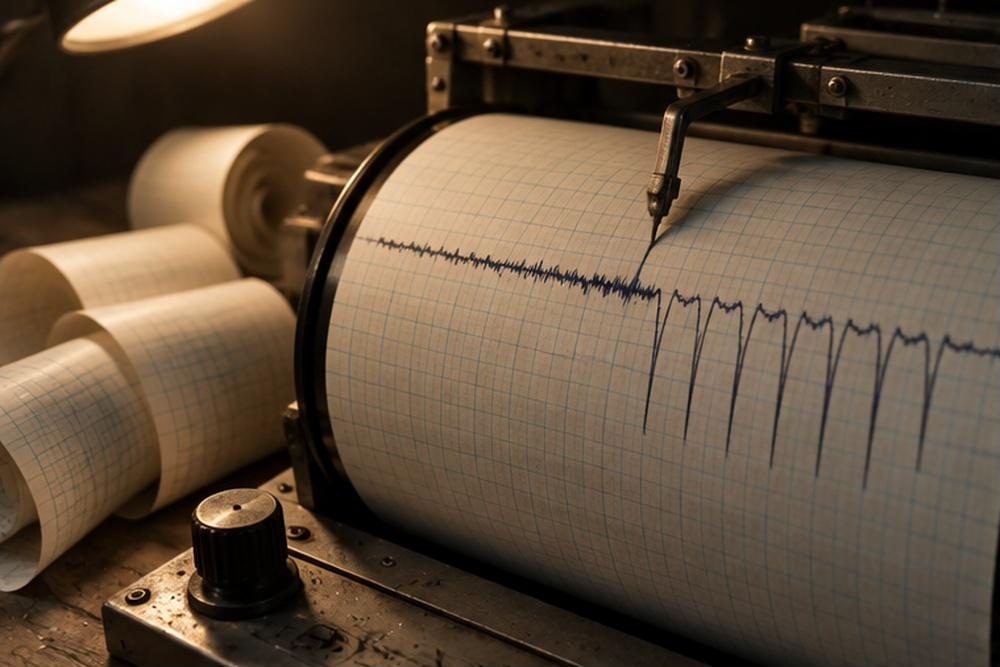
Figure F16-01. The chart trace. Astronomy’s first pulsar arrived as a scribble of ink on a moving roll of paper, and had to be picked out by eye from three kilometres of it a fortnight.
Nothing in astronomy was known to behave like this. Stars vary in brightness over days or months, not in a heartbeat, and nothing so regular had ever been seen in nature at all. The obvious suspicion was equipment, and enormous effort went into eliminating it.
Little green men
The other possibility, which they took seriously enough to discuss and not seriously enough to believe, was that the signal came from another civilisation. They labelled the source LGM-1, for Little Green Men.
Bell has described her reaction as irritation rather than excitement: she was trying to finish a doctoral thesis, and a signal from aliens would have made that impossible. The question was settled within weeks. A signal from a planet orbiting a star should drift in frequency as the planet moves around it, and this one did not. More decisively, just before Christmas, Bell found a second pulsing source in a completely different part of the sky, with a different period. Two independent civilisations both broadcasting at the same radio frequency, at exactly the wrong moment in human history, was not credible. Whatever this was, it was natural.
The discovery paper appeared in Nature in February 1968, with Hewish’s name first and Bell’s second. The objects were named pulsars, a contraction of pulsating radio sources.
Cosmic lighthouses
The explanation followed quickly, and it had been sitting in the literature for thirty-four years.
In 1934, two years after the neutron was discovered, Walter Baade and Fritz Zwicky, the same Zwicky who found dark matter in chapter 10, proposed that a supernova is the collapse of an ordinary star into a star made of neutrons. They had no evidence whatever; it was a guess of extraordinary boldness, and everyone ignored it, because such an object would be far too small and faint to observe.
A neutron star is what chapter 15 left behind when the core of a massive star collapsed. It is about twenty kilometres across, contains between one and two times the mass of the Sun, and is essentially a single enormous atomic nucleus held together by gravity. Its surface gravity is about a hundred billion times the Earth’s. Dropping a pebble from a metre above it would release the energy of a tonne of TNT.
KEY CONCEPT — What a teaspoon weighs
The density of a neutron star is hard to take seriously, so it is worth working through.
An ordinary atom is almost entirely empty space: the companion volume calculates that a solid object is about 99.9999999999996 per cent void, with a dense nucleus at the centre of each atom and the rest given over to the thin haze of its electrons. In a neutron star, that emptiness has been squeezed out entirely. The electrons have been crushed into the protons, leaving neutrons packed shoulder to shoulder as they are inside a nucleus.
The resulting density is about 10¹⁷ kilograms per cubic metre. A teaspoon holds about five cubic centimetres, so a teaspoon of neutron star material weighs about 500 million tonnes: roughly the mass of every human being alive, in a spoon. A sugar-cube-sized piece would weigh about as much as Mount Everest.
Sit the whole object next to something familiar: a mass greater than the Sun, in a sphere that would fit inside the M50 ring road around Dublin.
Two things happen when a stellar core collapses to this size, and both follow from ordinary physics. It spins up, for the same reason a skater spins faster on pulling in her arms, from perhaps one turn a month to many turns a second. And its magnetic field, squeezed into a far smaller area, becomes a trillion times stronger than the Earth’s.
A strong magnetic field on a fast-spinning object sweeps charged particles around with it, and those particles pour out radio waves in two narrow beams along the star’s magnetic poles. The magnetic poles are generally not aligned with the spin axis, any more than the Earth’s are, so the beams sweep around the sky like the beams of a lighthouse. If one of them happens to cross the Earth, a radio telescope sees a pulse once every rotation. Most neutron stars beam in a direction that never points at us, and are invisible.
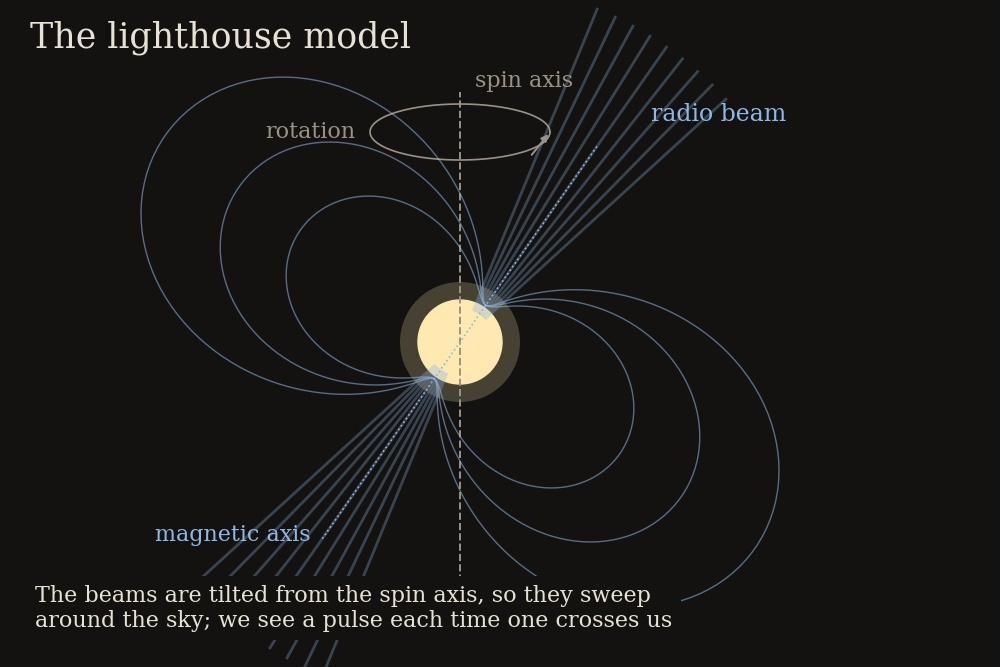
Figure F16-02. The lighthouse model. A neutron star’s beams emerge along its magnetic poles, which are tilted from its spin axis, so they sweep across space once per rotation.
The clinching evidence came in late 1968, when a pulsar was found at the centre of the Crab Nebula, the wreckage of the supernova that Chinese astronomers recorded in 1054. It pulses thirty times a second. Here was a neutron star, in a supernova remnant, of exactly the kind Baade and Zwicky had proposed, and its rotation was measurably slowing as it radiated its energy away, which also explained what had been keeping the Crab Nebula glowing for nine hundred years.
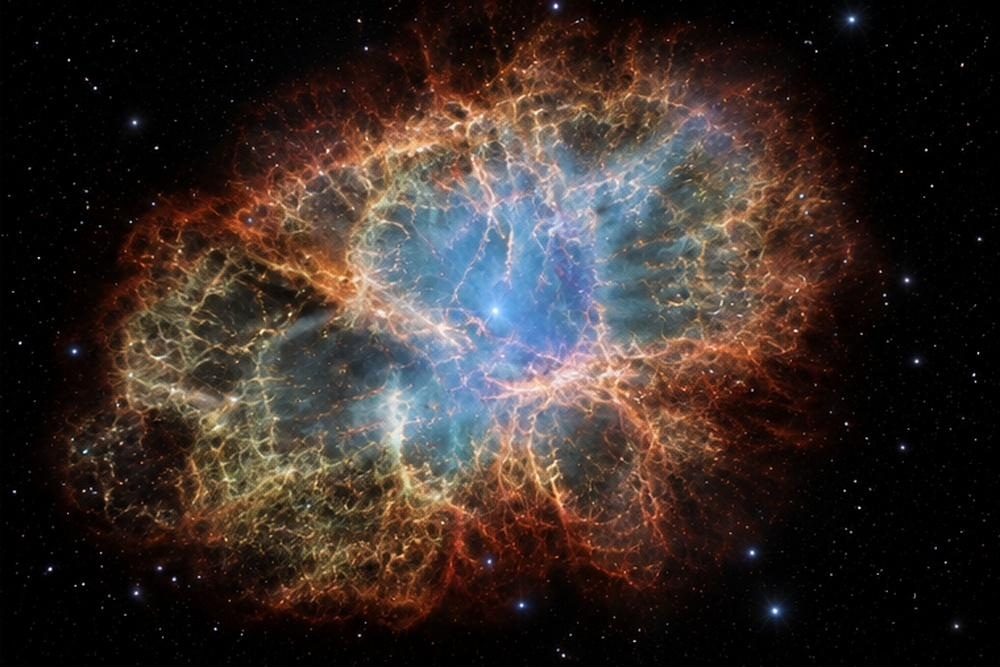
Figure F16-03. The Crab Nebula, the remains of the supernova of 1054. At its heart a neutron star spins thirty times a second, and the energy it sheds lights the whole nebula.
The Nobel question
In 1974 the Nobel Prize in Physics was awarded for the discovery of pulsars, to Antony Hewish and to Martin Ryle, the radio astronomer of chapter 7. Bell Burnell was not included.
The decision caused lasting controversy, most vocally from Fred Hoyle, who argued publicly that the prize had gone to the wrong person. Bell Burnell’s own position has been consistent and generous: that prizes should normally go to supervisors, that it was Hewish’s project and his idea, and that being at the centre of the argument did her career no harm. Others have pointed out that it was she who noticed the scruff, she who insisted on chasing it, and she who distinguished it from interference, and that supervisors had no comparable difficulty accepting prizes for work done by male students.
Her career since has been formidable: professor, president of the Royal Astronomical Society, president of the Institute of Physics, the first woman to be president of the Royal Society of Edinburgh. In 2018 she was awarded the Breakthrough Prize in Fundamental Physics, worth three million dollars, and she gave every penny of it to the Institute of Physics to fund doctoral scholarships for students from under-represented groups: women, ethnic minorities, refugees. Asked why, she said that her own career had shown how much a minority perspective is worth in science.
Ireland has kept her. She was born in Belfast and grew up in Lurgan, where she was initially not allowed to study science at school, a rule her parents fought. Birr Castle, where Lord Rosse built the Leviathan in chapter 5, now hosts I-LOFAR, an array of low-frequency radio antennas that forms part of a Europe-wide network, and one of the things it observes is pulsars. The Irish midlands have been involved in this subject twice, a century and a half apart.
Clocks in the sky
Pulsars turned out to be the most precise natural clocks in the universe.
A neutron star is so massive and so compact that almost nothing can disturb its rotation. The fastest, called millisecond pulsars, have been spun up by stealing gas from a companion star and rotate as fast as seven hundred times a second, which means a surface moving at an appreciable fraction of the speed of light. Their pulse arrival times can be predicted years in advance to within a few hundred nanoseconds. The best of them rival atomic clocks.
That precision makes them instruments. In 1974 Russell Hulse and Joseph Taylor found a pulsar in orbit around another neutron star, and by timing its pulses they could track the orbit with extraordinary accuracy. The orbit was shrinking, by about seven and a half millimetres a day.
General relativity predicts exactly this. Two massive objects in orbit stir up ripples in spacetime, gravitational waves, which carry energy away; losing energy, the orbit tightens. Hulse and Taylor measured the shrinkage over years and found it matched Einstein’s prediction to better than one per cent. It was the first proof that gravitational waves exist, thirty years before one was detected directly, and it earned the Nobel Prize in 1993.
Pulsar timing has since been used to test general relativity in strong gravity, to weigh neutron stars, to detect the first planets found outside the solar system, in 1992, and to navigate: a spacecraft that can see several pulsars can work out where it is, anywhere in the galaxy, from their pulse timings alone.
Inside a neutron star
Nobody will ever cut one open, but there is a fair amount of evidence about what a neutron star is like inside, and the picture is peculiar enough to be worth a paragraph.
The outside is a surface of iron nuclei, perfectly smooth: the gravity is so strong that the tallest possible mountain on a neutron star is a fraction of a millimetre high. Below that is a crust, a rigid lattice of nuclei ten billion times stronger than steel. Deeper still, the nuclei are so crowded that they are thought to deform into rods and sheets, shapes that theorists have nicknamed nuclear pasta, and which may be the strongest material in the universe. Below the crust the matter becomes a fluid of neutrons, and, because it is extraordinarily cold compared with the energies involved, it is thought to be a superfluid, a state that flows without any friction at all. The very centre, where the pressure is highest, may not be made of neutrons at all but of free quarks, and nobody knows.
There is observational evidence for some of this. Most pulsars slow gradually and predictably, but occasionally one speeds up abruptly, by a few parts in a million, in what is called a glitch. The usual explanation is that the superfluid interior rotates slightly faster than the solid crust, and every so often the two are jerked back into step, a transfer of spin from inside to outside. Glitches are one of the few direct clues to the state of matter in there.
The other clue is size. NASA’s NICER instrument, mounted on the International Space Station, measures the shape of the X-ray pulses from hot spots on a neutron star’s surface. Because the star’s own gravity bends the light from the far side into view, the shape of the pulse depends on the ratio of mass to radius, so timing the X-rays measures the size. The answers, published from 2019 onwards, put the radius of a typical neutron star at around twelve kilometres, which is already enough to rule out some proposed theories of how matter behaves at these densities. Neutron stars are, in effect, the only laboratories in which such matter can be studied, and astronomers are using them to do nuclear physics that no accelerator on Earth can reach.
Magnetars and mystery bursts
Some neutron stars are stranger than others.
A magnetar is a neutron star with a magnetic field a thousand times stronger than normal, which is to say about a thousand trillion times the Earth’s: the strongest magnetic fields known to exist. The field is strong enough to distort atoms into thin cigars and, at a distance of a thousand kilometres, would wipe the data from a credit card.
Occasionally a magnetar’s crust cracks under the magnetic strain, and it releases a flare. On 27 December 2004, a magnetar fifty thousand light-years away, halfway across the galaxy, emitted a burst that in a tenth of a second released more energy than the Sun produces in a hundred thousand years. It measurably ionised the Earth’s upper atmosphere and briefly saturated the detectors of every gamma-ray satellite then in orbit.
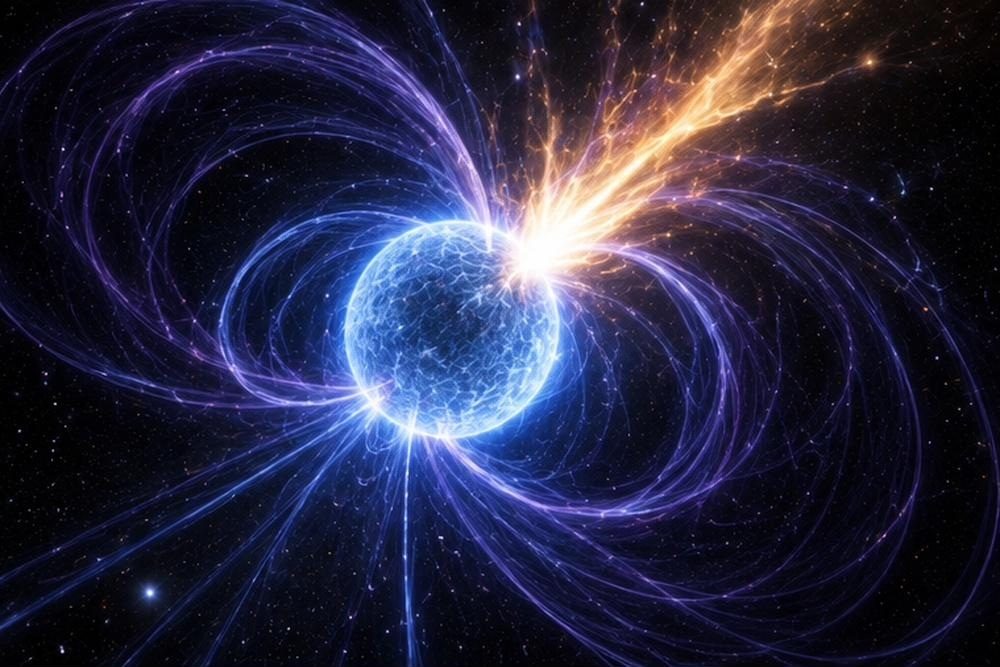
Figure F16-04. A magnetar flaring. When the crust of a hypermagnetised neutron star cracks, the energy released in a fraction of a second can exceed everything the Sun emits in a hundred thousand years.
Then there are fast radio bursts, discovered in 2007: flashes of radio waves lasting a few thousandths of a second, arriving from other galaxies, each releasing in that instant as much energy as the Sun does in days. Thousands are now known, and some repeat. Their cause was mysterious until April 2020, when a burst was detected coming from a magnetar inside our own galaxy, which established that at least some fast radio bursts are magnetar flares. Whether all of them are is still open. Because their signals are smeared out in a way that depends on how much gas they pass through, they have become an unexpected tool for weighing the thin material between galaxies, which had proved hard to account for by any other means.
The collision that made gold
On 17 August 2017, the gravitational-wave detectors described in the next chapter registered a signal lasting a hundred seconds, quite unlike the black-hole mergers they usually saw. Two seconds later, two gamma-ray satellites recorded a short burst from roughly the same part of the sky. Within eleven hours, telescopes in Chile had found a new point of light in a galaxy 130 million light-years away, and over the following weeks about seventy observatories, on the ground and in space, watched it fade across every wavelength from radio to gamma rays.
Two neutron stars had spiralled together and merged.
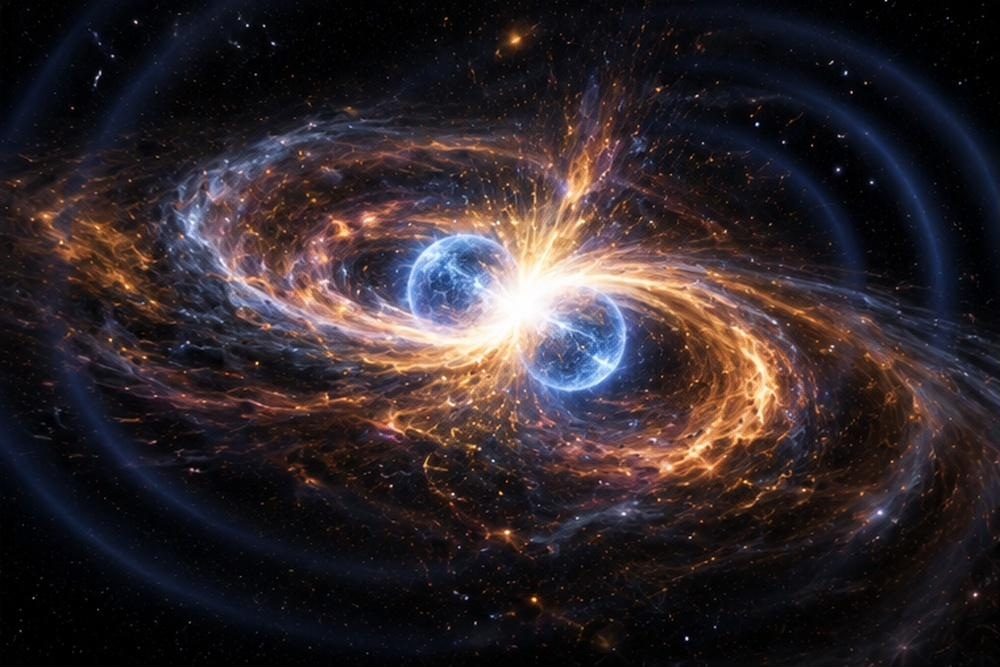
Figure F16-05. Two neutron stars merging. In the seconds around the collision, a few Earth-masses of heavy elements are forged, including much of the gold and platinum in the universe.
The event settled several arguments at once. It confirmed that short gamma-ray bursts come from neutron-star mergers. It showed that gravitational waves travel at the speed of light, to within a few parts in a million billion, which ruled out whole families of modified-gravity theories that had been proposed as alternatives to dark energy. It provided a distance measured directly from the gravitational waves, with no distance ladder, giving an independent value for the Hubble constant of chapter 13.
And the fading light told chemists something they had suspected. The glow was powered by the radioactive decay of freshly made heavy elements, and its colour and fading pattern indicated a few per cent of the Earth’s mass in gold and platinum, and perhaps ten Earth-masses of heavy elements in total. When neutron stars collide, some of their material is flung out; freed from the crushing pressure, those neutrons decay and build up into the heaviest elements in nature almost instantly. Chapter 15 listed the sources of the elements; this is where the rarest of them come from. Any gold you own was made in a collision like this one, somewhere in the galaxy, before the Sun was born.
The hum of the universe
Finally, pulsars have been turned into a gravitational-wave detector the size of the galaxy.
A gravitational wave passing through the space between us and a pulsar stretches and squeezes that space, so the pulses arrive a fraction earlier or later than predicted. The effect from any single wave is far too small to see in one pulsar. But if you monitor dozens of millisecond pulsars scattered across the sky for decades, a passing sea of very long gravitational waves would nudge all of their timings in a correlated pattern, with the correlation depending on the angle between any two pulsars on the sky.
In June 2023, four collaborations in North America, Europe, Australia and China announced, independently and simultaneously, that they had found that pattern. The evidence was at about three to four sigma: a hum of gravitational waves with periods of years, washing through the galaxy.
The most likely source is the combined signal of millions of pairs of supermassive black holes, each pair in the centre of a galaxy that formed when two galaxies merged, orbiting one another over years or centuries before eventually colliding. If so, pulsar timing has opened a new window on how galaxies grow, described in chapter 18. Other explanations are possible, including gravitational waves left over from the early universe itself, and chapter 22 returns to them. Longer datasets, and the Square Kilometre Array, should tell which.
Where this leaves us
A neutron star is the least reasonable object in this book so far: a city-sized ball of nuclear matter with the mass of a sun, spinning hundreds of times a second, with a magnetic field beyond anything that can be made on Earth, keeping time better than a laboratory clock, and forging gold when it collides with its own kind.
And yet it is a stable object, held up by a rule about how neutrons refuse to be packed any tighter. Squeeze more mass onto it, past about two and a half times the mass of the Sun, and that rule fails too. Nothing else is left. The collapse continues, and does not stop.
Chapter 17 — Black Holes
“God not only plays dice, He sometimes throws the dice where they cannot be seen.” — Stephen Hawking, 1975
Dark stars
In November 1783 an English country clergyman read a paper to the Royal Society that was two centuries ahead of its time. John Michell, rector of Thornhill in Yorkshire and a formidable scientist in his spare hours, had been thinking about Newton’s idea that light is a stream of particles. If light particles are affected by gravity like everything else, he reasoned, then a star could in principle be so massive that light leaving its surface would be pulled back before escaping.
He worked out the conditions: a star with the same density as the Sun but five hundred times its diameter would trap its own light. Such objects, he pointed out, would be invisible, but if they had companion stars in orbit around them, their presence could be inferred from the motion of the companion. That is exactly how the first black hole was found, 188 years later. Pierre-Simon Laplace published the same idea independently in 1796, then quietly dropped it from later editions when light came to be understood as a wave, since nobody knew whether a wave would be affected by gravity.
The idea was forgotten for 130 years. It came back through a completely different door.
The solution nobody wanted
In late 1915, within weeks of Einstein publishing general relativity, a German astronomer named Karl Schwarzschild found the first exact solution to its equations, describing the curved spacetime around a spherical mass. He did the work while serving on the Russian front in the First World War, sent it to Einstein, who was impressed, and died of an illness contracted in the trenches a few months later, aged forty-two.
Schwarzschild’s solution had an oddity. At a certain distance from the centre, which depends only on the mass, the mathematics behaved strangely: time appeared to stop and distances became infinite. For any ordinary object this was irrelevant, because the critical distance lay far inside the body, where the solution did not apply. For the Sun it works out at about three kilometres, deep within the Sun’s interior. But if the mass were compressed inside that radius, the strange surface would be out in empty space.
THE EQUATION — How small is small enough?
The critical size is called the Schwarzschild radius, and the formula is simple: r = 2GM ÷ c², where M is the mass, G is Newton’s gravitational constant from chapter 3 and c is the speed of light.
The speed of light appears multiplied by itself in the denominator, which is an enormous number, so the radius is tiny for ordinary masses. Worked examples:
- The Earth: squeeze it to a radius of about 9 millimetres, the size of a grape.
- The Sun: squeeze it to a radius of about 3 kilometres.
- A star twenty times the Sun’s mass: about 60 kilometres.
- The black hole at the centre of our galaxy, four million solar masses: about 12 million kilometres, roughly a sixth of the distance from the Sun to Mercury.
The radius grows in simple proportion to the mass, which has a surprising consequence. Double the mass and you double the radius, but you have eight times the volume to put it in, so the average density falls. A black hole of a few billion solar masses has an average density lower than water. Being a black hole is not about being dense; it is about being compact enough for your size.
Nobody believed nature would do this. Eddington, who had ridiculed Chandrasekhar for the white dwarf limit in chapter 15, was equally certain here, and said that there should be a law of nature to prevent a star collapsing in such an absurd way. In 1939 Robert Oppenheimer and Hartland Snyder published a calculation showing that a sufficiently massive star, having exhausted its fuel, must collapse indefinitely, with nothing able to stop it. The paper appeared on 1 September 1939, the day Germany invaded Poland, and was ignored for twenty years while its author went off to build an atomic bomb.
The subject came back to life in the 1960s, with better mathematics and the discovery of quasars, which plainly required something extraordinary to power them. Roger Penrose proved in 1965 that collapse to a singularity is not a special case requiring perfect symmetry, as had been hoped, but the generic outcome, an argument that won him the Nobel Prize fifty-five years later. And in 1967 the physicist John Archibald Wheeler popularised a short, vivid name for these objects. They had been called frozen stars or collapsed stars; he called them black holes.
Falling in
What is a black hole, physically? Not a thing, in the ordinary sense. It is a region of spacetime so strongly curved that all paths leading out of it bend back inside.
The boundary of that region is the event horizon, and it is not a surface in any material sense: there is nothing there, no membrane, nothing to touch. It is a place where the geometry changes character. Outside it, you can move towards or away from the centre as you like. Inside it, moving away from the centre is as impossible as moving into yesterday; every possible path leads inwards. That is why nothing escapes, including light, and why the word “hole” is better than “star”.
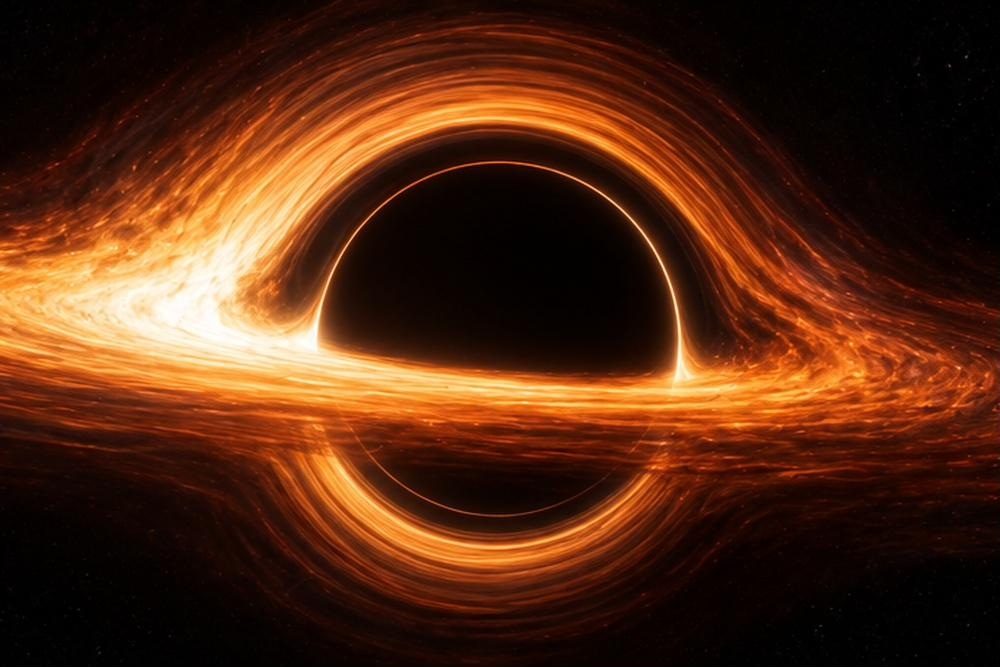
Figure F17-01. A black hole with a disc of infalling gas. Gravity bends the light so severely that the far side of the disc appears lifted over the top of the hole, and the dark centre is surrounded by a ring of light.
Three things happen to someone falling in, and they are worth separating because films usually muddle them.
First, tides. Gravity pulls harder on your feet than your head, because your feet are closer. Near a stellar-mass black hole this difference is savage enough to stretch a person into a thin stream, a process the physicist Kip Thorne nicknamed spaghettification. Curiously, the bigger the black hole, the gentler the tide at the horizon: falling into a supermassive black hole, you would cross the horizon without feeling anything unusual at all.
Second, time. To a distant observer watching you fall, your clock appears to run slower and slower as you approach the horizon, your image reddens and dims, and you seem to freeze at the edge, never quite crossing. To you, nothing of the kind happens: you cross the horizon at a definite moment, in ordinary time, and notice nothing special at the crossing. Both descriptions are correct, which is a lesson in what relativity actually means.
Third, the end. The theory says that everything that falls in is crushed into a singularity at the centre, a point of infinite density where the equations stop making sense. Almost nobody believes that literally. An infinity in a theory is a sign that the theory has been pushed beyond its range, and here that range is where gravity meets the quantum, which is exactly the unsolved problem of chapter 22.
The first candidate
Michell’s suggestion of finding an invisible star by watching its companion is how it was done.
In 1964 rocket-borne detectors found a powerful source of X-rays in the constellation Cygnus, named Cygnus X-1. By 1971 radio and optical astronomers had matched it to a blue supergiant star, which was found to be orbiting an unseen companion every five and a half days. From the orbit, the invisible object weighed far more than the Chandrasekhar limit allowed for a white dwarf, and more than any neutron star could be. Something that heavy and that small, and pouring out X-rays as gas from the companion star spiralled in and heated up, had no other explanation.
Kip Thorne and Stephen Hawking made a famous bet about it in 1974, Hawking betting against the black hole, as insurance: if it turned out not to be one, he said, he would at least win the bet, a year’s subscription to a magazine. He conceded in 1990.
The monster at the centre
The most convincing evidence of all came from watching stars orbit something invisible at the centre of our own galaxy.
From the early 1990s, two teams, one led by Reinhard Genzel in Germany and one by Andrea Ghez in California, used the largest telescopes in the world, with optics that correct for the blurring of the atmosphere, to track individual stars in the crowded core of the Milky Way, twenty-six thousand light-years away behind heavy dust. Over two decades they watched those stars move.
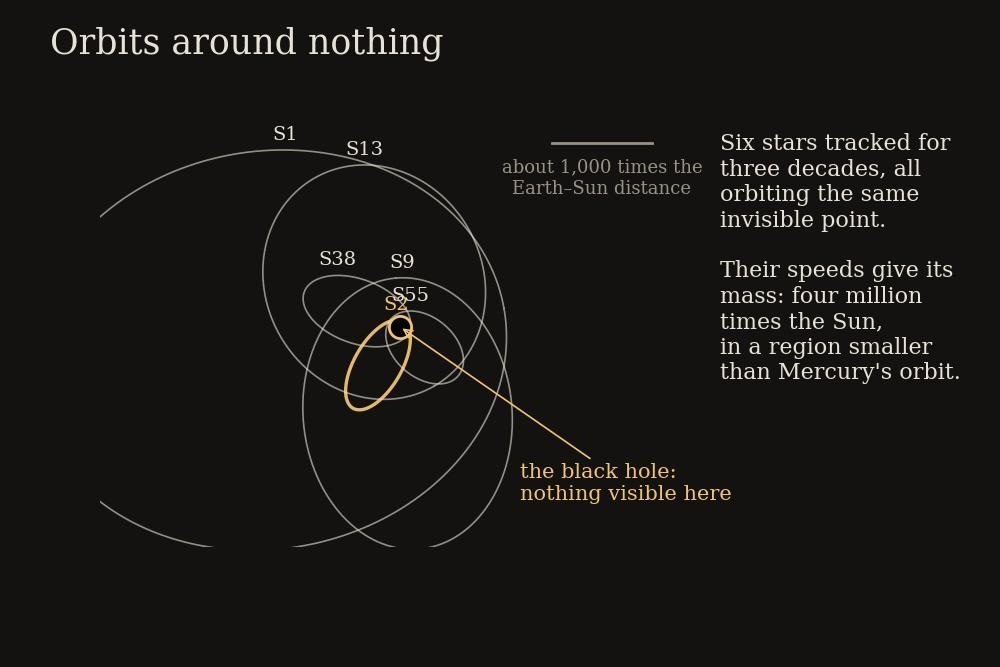
Figure F17-02. Stars orbiting the centre of the Milky Way. Tracked for three decades, they trace ellipses around a common focus where nothing is visible. Their speeds give the mass: four million Suns.
One star, known as S2, completes an orbit every sixteen years, sweeping to within about 120 astronomical units of the centre at a speed of nearly 8,000 kilometres per second, around three per cent of the speed of light. Kepler’s third law from chapter 2 turns those numbers into a mass, and the answer is about four million times the mass of the Sun, confined within a region smaller than the orbit of Mercury. No cluster of ordinary stars could sit in that space without collapsing. Genzel and Ghez shared the 2020 Nobel Prize with Penrose.
The orbits have since been measured well enough to test general relativity in strong gravity. S2’s light reddens as predicted when it swings closest, and its orbit precesses, rotating slightly with each pass, by the amount Einstein’s theory requires. This is Mercury’s anomaly from chapter 3, in a gravitational field a thousand times stronger.
The chirp of 2015
On 14 September 2015, two detectors in the United States, one in Louisiana and one in Washington state, recorded an identical tiny shudder seven milliseconds apart.
Each detector, called LIGO, is an L with arms four kilometres long, down which laser beams travel to mirrors and back. A gravitational wave passing through stretches one arm and squeezes the other, and by combining the returning beams the difference can be measured. The scale of the measurement is what makes it absurd: the change in length to be detected is about one part in 10²¹, which over four kilometres is a thousandth of the width of a proton. The experiment had been proposed in the 1970s, funded through decades of scepticism, and had run for years without seeing anything.
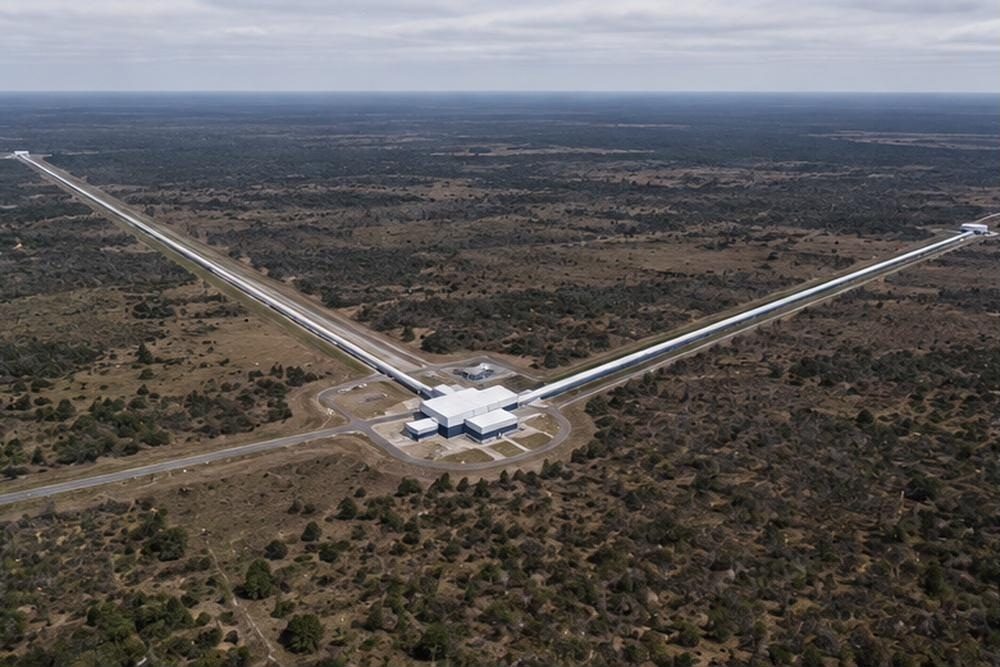
Figure F17-03. A gravitational-wave detector. Laser beams travel down four-kilometre arms and back, measuring changes in length a thousand times smaller than a proton.
The signal lasted two tenths of a second. Its frequency and amplitude rose together, then stopped abruptly: a chirp. It was exactly the waveform predicted for two black holes, of about 36 and 29 solar masses, spiralling together and merging, 1.3 billion light-years away. In the final moments they were orbiting each other sixty times a second at half the speed of light, and the merger converted three solar masses of material into gravitational waves, briefly radiating more power than all the stars in the observable universe combined.
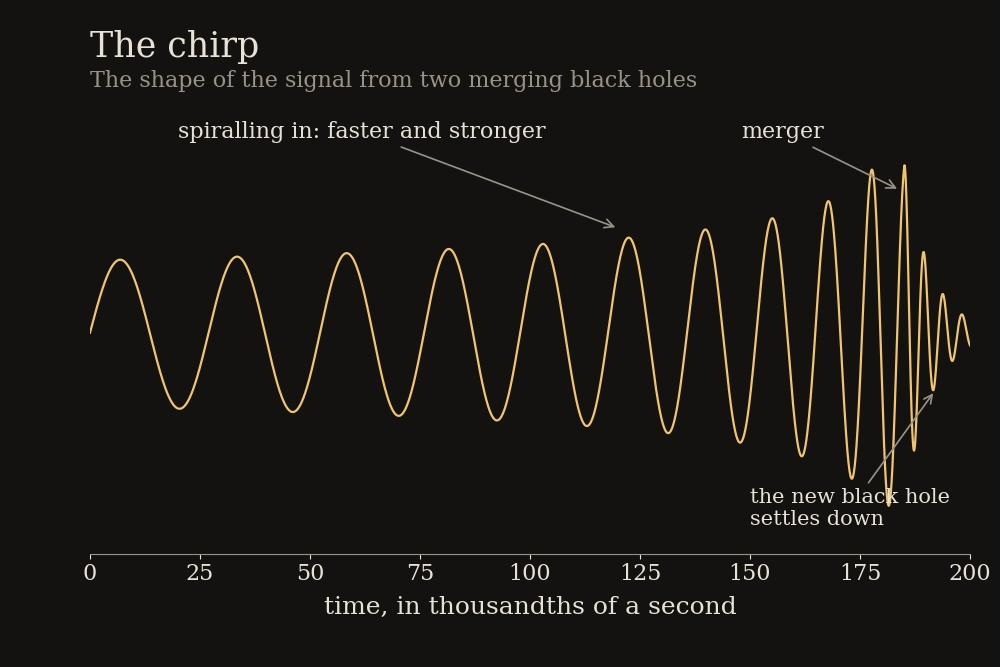
Figure F17-04. The chirp. Two black holes spiralling together produce a wave that rises in pitch and strength, then cuts off as they merge and the new hole settles down.
The announcement came in February 2016, and the Nobel Prize followed in 2017. As chapter 14 recorded, there are now 390 confirmed detections, and the catalogue includes black holes heavier than theory expected stars to produce, which suggests some of them are the product of earlier mergers in dense star clusters. Gravitational waves have turned black holes from inferences into objects that can be weighed, counted and heard.
The picture of the shadow
In April 2019 came an image that made the front pages: a fuzzy orange ring with a dark centre, the first direct picture of the region around a black hole.
The Event Horizon Telescope is not a telescope but a network of radio dishes from Spain to Hawaii to the South Pole, observing simultaneously and combining their data so that they act as a single instrument the size of the Earth. That gives an angular resolution fine enough to read a newspaper in New York from a café in Paris, which is what it takes to resolve a black hole from across the universe.
The first target was the giant at the centre of the galaxy M87, fifty-five million light-years away and weighing six and a half billion Suns. The picture shows what theory predicted: a bright ring of light from hot gas swirling just outside the horizon, brighter on one side where the gas is rushing towards us, and a dark region in the middle, the black hole’s shadow. In 2022 the same network published an image of Sagittarius A*, the four-million-solar-mass hole at the centre of our own galaxy, which is much closer but a thousand times smaller and changes far faster, making it harder to photograph.
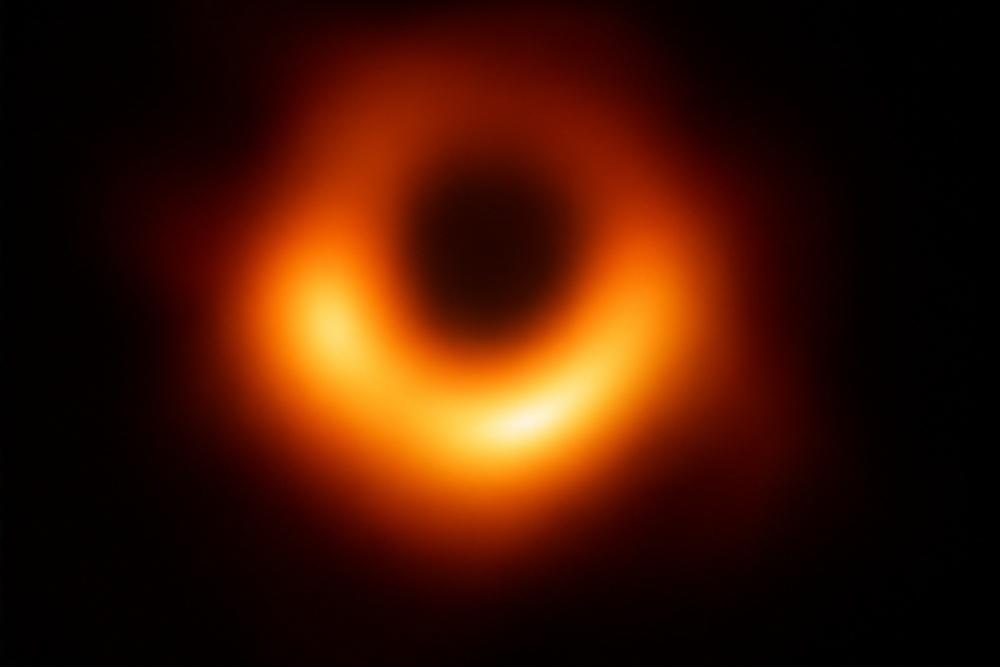
Figure F17-05. The shadow of a black hole. The ring is light from gas orbiting just outside the horizon, bent around the hole by its gravity; the darkness at the centre is the hole itself.
The brightest things in the universe
A black hole is invisible. Paradoxically, the brightest steady objects in the universe are powered by them, and the reason is that falling into one is an extremely efficient way of releasing energy.
Gas approaching a black hole rarely falls straight in. It has some sideways motion, so it settles into a flat, spinning disc, and friction within the disc makes it spiral slowly inwards, converting gravitational energy into heat as it goes. By the time it reaches the inner edge it is orbiting at a sizeable fraction of the speed of light and is heated to millions of degrees, glowing in X-rays. Something like a tenth of the infalling mass is converted into radiation before the rest disappears over the horizon, which is about twenty times more efficient than the nuclear fusion that powers a star.
That is the engine behind the quasars of chapter 7 and the active galaxies of chapter 18. Feed a black hole of a billion solar masses a few solar masses of gas a year, and it will outshine every star in its galaxy from a region no bigger than the solar system. Many such systems also fire two narrow jets of material outward along their spin axes at almost the speed of light, held together by twisted magnetic fields; these can extend for hundreds of thousands of light-years, far beyond the galaxy that launched them. Precisely how the jets are produced is still argued over, though it is generally accepted that they draw their energy from the spin of the black hole itself, an idea worked out by Roger Blandford and Roman Znajek in 1977.
There is a limit to how fast this can run. Radiation from the infalling gas pushes outward on gas still arriving, and beyond a certain rate the outward push balances the inward pull and the supply chokes itself off. That ceiling, called the Eddington limit after the same Eddington who was so sure black holes could not exist, sets how quickly a black hole can grow, and it is the reason the early giant black holes described at the end of this chapter are such a puzzle.
Hawking’s glow
In 1974 Stephen Hawking published the most surprising result in the subject, and it came from applying quantum theory near the horizon.
Quantum mechanics says empty space is not empty: pairs of particles continually appear and annihilate, borrowing energy for a moment. Hawking realised that near a horizon, one of a pair can fall in while the other escapes, so that a distant observer sees a faint stream of particles emerging. A black hole is not entirely black. It glows, extremely faintly, and it slowly loses mass as it does so.
The temperature of the glow depends inversely on the mass, which has an odd consequence: big black holes are colder than small ones, so as a black hole evaporates it gets hotter and evaporates faster, ending in a flash. A black hole of a few solar masses has a temperature of about a ten-millionth of a degree above absolute zero, far colder than the microwave background, which means it absorbs more than it emits and is currently growing, not shrinking. Only when the universe has expanded and cooled for far longer will evaporation take over. Chapter 21 gives the timescales, and they are staggering.
Hawking radiation has never been observed and probably never will be directly, but it is accepted because it follows from two well-tested theories applied together. It also creates the deepest known problem in physics.
KEY CONCEPT — The information paradox
Quantum mechanics has a strict rule: information is never destroyed. In principle, the complete details of any physical system can be reconstructed from its future state, however scrambled. Burn a book and the information is hopelessly jumbled in the smoke and ash, but it is still there.
Now drop the book into a black hole. The book is gone, and after unimaginable ages the hole evaporates into Hawking radiation. But Hawking’s calculation says that radiation depends only on the hole’s mass, spin and charge, and carries no trace of what fell in. The information appears to have been destroyed, which quantum mechanics forbids.
Something in the argument must be wrong, and the candidates are all unpalatable: that general relativity fails at the horizon, that quantum mechanics fails, or that the information is subtly encoded in the radiation in a way nobody has fully worked out. Hawking himself changed his mind in 2004 and conceded a bet on the subject. Most theorists now believe the information does escape, and work since 2019 on the mathematics of evaporating holes has made that case stronger, but there is no agreed account of the mechanism. The paradox has become the sharpest available probe of what a theory of quantum gravity must look like, which is why chapter 22 returns to it.
Too big, too early
One question about black holes belongs squarely to cosmology, and chapter 14 has already raised it.
Quasars are found in the early universe powered by black holes of a billion solar masses, existing when the universe was less than a billion years old. Growing a black hole takes time, because infalling gas heats up and its radiation pushes further gas away, which sets a maximum feeding rate. Starting from a seed of the size left by a dying star, there is not enough time to reach a billion solar masses that early.
The proposed solutions are that the seeds were large to begin with, formed by the direct collapse of a giant gas cloud rather than a star; that the growth was faster than the classical limit, which is possible if the gas is dense enough to smother the outgoing radiation; or both. The little red dots of chapter 14, which in 2026 look like young black holes swaddled in dense gas and feeding hard, are exactly what the second option predicts. If that interpretation holds, one of the strangest discoveries of the JWST era will turn out to have solved one of the older puzzles about black holes.
Where this leaves us
Black holes began as a speculation by a Yorkshire clergyman, became an embarrassing feature of Einstein’s equations that nobody wanted to take seriously, and are now routine: weighed by the orbits of stars, heard as they collide, and photographed. There are perhaps a hundred million of stellar mass in the Milky Way alone, and one giant at the centre of nearly every large galaxy.
They are also, for a physicist, the most interesting objects in existence, because they are where our two best theories contradict each other. Everything else in this book can be described by general relativity or quantum mechanics separately. A black hole needs both, and they do not agree.
The next chapter zooms out from single objects to the structures they live in: galaxies, the clusters they gather into, and the web of filaments and voids that is the largest pattern in the universe.
Chapter 18 — Galaxies and the Cosmic Web
“Science progresses best when observations force us to alter our preconceptions.” — Vera Rubin
Our place in the Milky Way
Start at home. The Milky Way is a barred spiral galaxy containing somewhere between one and four hundred billion stars, and it is bigger and more structured than the smudge of light across a dark sky suggests.
Seen from outside, it would appear as a flat disc about 100,000 light-years across and only about a thousand light-years thick, which is the proportions of a compact disc or a dinner plate. From the centre extends a bar of older, yellower stars perhaps 25,000 light-years long, and from the ends of that bar wind several spiral arms, marked out by bright blue newborn stars and glowing gas. Around the centre swells a bulge of old stars, and at the very middle sits the four-million-solar-mass black hole of chapter 17.
Surrounding all of it is a roughly spherical halo, containing the globular clusters that Shapley used in chapter 5, a thin scattering of very old stars, and, extending far beyond everything visible, the dark matter of chapter 10, which outweighs everything else in the galaxy by a factor of five or more.
The Sun sits about 26,000 light-years from the centre, in a minor spur between two major arms, and takes roughly 230 million years to complete one orbit at about 230 kilometres per second. It has made perhaps twenty circuits since it formed.
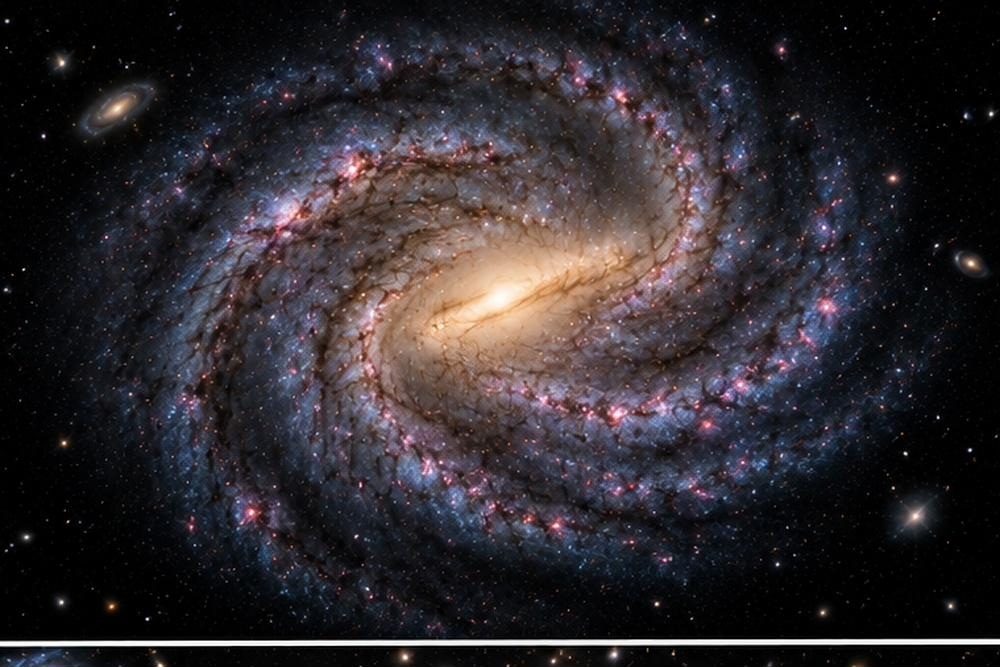
Figure F18-01. The Milky Way from outside, as we now map it. The Sun lies in a minor spur about a quarter of the way in from the edge, and takes 230 million years to go round once.
Mapping our own galaxy from inside it is difficult, for the reason chapter 5 gave: dust blocks the view along the disc. The modern map comes from radio and infrared observations, which penetrate dust, and above all from the European Gaia satellite, which between 2014 and 2025 measured the positions, distances and motions of nearly two billion stars. Gaia turned the Milky Way from a picture into a three-dimensional survey, and it has revealed that our galaxy is not a placid object. Its disc is warped and rippling, as if struck. Streams of stars arc through the halo, the shredded remains of smaller galaxies pulled apart and swallowed. One such stream, from a galaxy that collided with ours around ten billion years ago, contributes a substantial fraction of the halo’s stars, and was identified from Gaia data in 2018.
The Milky Way, in other words, is a galaxy assembled from smaller pieces, and still eating.
A zoo of shapes
Hubble, having established in chapter 5 that galaxies are separate systems, set about classifying them, and his scheme is still used.
Spirals are flat rotating discs with arms, like ours, usually with a central bulge. About two-thirds have a bar. They are rich in gas and dust and are actively making new stars, which is what makes their arms blue and bright.
Ellipticals are smooth featureless ovals of old red stars, ranging from dwarf systems to monsters containing trillions of stars. They have little gas, almost no new star formation, and their stars orbit in random directions rather than in an organised disc, more like a swarm of bees than a whirlpool.
Irregulars have no clean shape, and are often small galaxies distorted by the pull of a larger neighbour. The Magellanic Clouds, visible from the southern hemisphere, are the nearest examples.
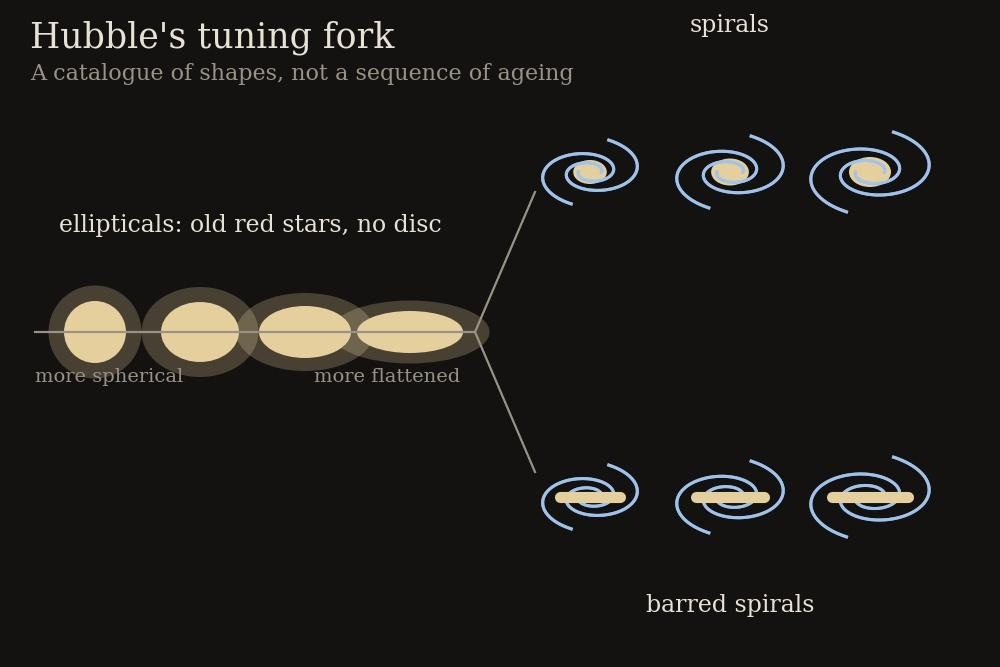
Figure F18-02. Hubble’s tuning fork. Ellipticals on the handle, ordinary and barred spirals on the two prongs. Hubble thought it was a sequence of ageing; it is not, but it remains a useful catalogue.
Hubble arranged these into a diagram shaped like a tuning fork and believed it showed an evolutionary sequence, with ellipticals ageing into spirals. That was wrong, and in a sense backwards: it is now thought that spirals can be turned into ellipticals when they collide and merge, which destroys their discs.
Two further facts about the population are worth having. First, galaxies come in wildly different sizes, and small ones vastly outnumber large ones: for every Milky Way there are dozens of dwarf galaxies, some containing only a few thousand stars but still bound together by dark matter. Second, there is a striking division in colour. Galaxies are either blue and forming stars or red and quiescent, with relatively few in between, which suggests that whatever shuts star formation down does so quickly. The leading suspect is the black hole at the centre: when it feeds, it heats and blows out the galaxy’s gas, and star formation stops. That link between an object a few light-hours across and a galaxy a hundred thousand light-years across is one of the more surprising results of the past twenty years.
When galaxies collide
Galaxies are not far apart compared with their own size. The distance between the Milky Way and Andromeda is only about twenty-five times the Milky Way’s diameter, whereas the nearest star to the Sun is thirty million times the Sun’s diameter. Galaxies are, cosmically speaking, crowded, and they collide often.
A collision is slow and, for the stars, almost harmless. The galaxies pass through each other over hundreds of millions of years, and the chance of two stars actually hitting is negligible, since stars are minute compared with the space between them. What does collide is the gas, which crashes together, compresses and ignites a burst of star formation. And what is wrecked is the structure: the discs are pulled into long tidal tails of stars, and if the galaxies merge, the orderly rotation is scrambled into the random orbits of an elliptical.
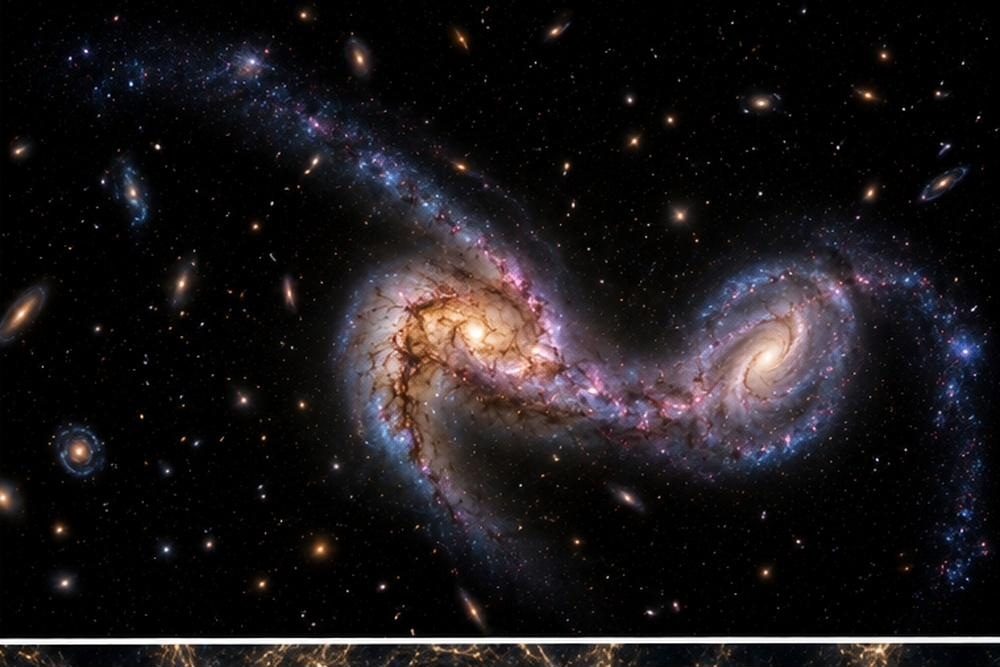
Figure F18-03. Two galaxies in collision. The stars almost never touch, but the discs are torn into tails and bridges, and the gas is compressed into a burst of new stars.
The Milky Way and Andromeda are approaching each other at about 110 kilometres per second, and for twenty years the textbook answer has been that they will collide in about four to five billion years and merge into a single elliptical galaxy, sometimes nicknamed Milkomeda. The Sun would survive, flung into a different orbit; the night sky would be spectacular for a few hundred million years.
That prediction has recently become less certain. The collision depends on the sideways component of Andromeda’s motion, which is very hard to measure, and on the gravitational influence of the other galaxies in our neighbourhood. A study published in 2025, using the best available data from Gaia and Hubble and running many thousands of simulations, found that the two galaxies have only about a fifty-fifty chance of merging within the next ten billion years. A near miss is just as likely. This is a good example of how a “known fact” in popular astronomy can quietly become an open question when the measurements improve.
Engines at the centre
Chapter 7 introduced quasars as the objects that helped kill the steady state, and chapter 17 explained the engine. Here is how they fit into the life of galaxies.
Nearly every large galaxy has a supermassive black hole at its centre, and the mass of that hole is closely related to the mass of the galaxy’s central bulge, a correlation found in the late 1990s that still surprises people. When gas falls onto the hole, the galaxy becomes an active galaxy, pouring out energy from its nucleus; when the supply runs out, it goes quiet. The Milky Way’s black hole is quiet now, though X-ray echoes off nearby gas clouds suggest it flared a few hundred years ago.
Quasars are simply the most extreme version, and they were far commoner in the early universe than now, because there was more gas available and galaxies were colliding more often, delivering it to the centre. The population of quasars peaked when the universe was about three billion years old and has declined ever since. In that sense, we live in a quiet, late era.
The breathing of a galaxy
A galaxy is not a fixed object with a fixed supply of stars. It is a system with an input, an output and a recycling loop, and thinking of it that way explains most of what galaxies do.
The input is gas falling in from outside, drawn along the filaments of the cosmic web. A large spiral like ours pulls in roughly one or two solar masses of fresh hydrogen a year, and needs to, because it is forming stars at about the same rate and would otherwise run dry within a couple of billion years.
The loop is the stars themselves. Chapter 15 described how stars return most of their material to space, gently through stellar winds and planetary nebulae, or violently in supernovae. Each generation hands back gas enriched with the elements it made, so the galaxy’s chemistry slowly changes, and the youngest stars contain the most heavy elements. The Sun, a relative latecomer, has about twice the heavy-element content of a typical star formed four billion years earlier.
The output is gas driven out altogether. Clusters of massive stars, exploding in quick succession, can blow bubbles hundreds of light-years across and launch fountains of gas thousands of light-years above the disc, some of which rains back down and some of which escapes. A feeding black hole can do the same on a far greater scale.
This accounting explains the two-colour population noted above. A galaxy stays blue as long as its supply of cold gas holds out. Cut off the supply, by stripping the gas as the galaxy falls into a cluster, or by heating it with a black hole, or simply by using it all up, and star formation stops within a billion years or so, the blue stars die first, and the galaxy reddens. Almost every red galaxy is a galaxy that has stopped being fed.
Clusters and superclusters
Galaxies are social. About half of them live in groups or clusters.
The Milky Way belongs to the Local Group, a modest collection about ten million light-years across containing two large spirals, ourselves and Andromeda, a third smaller spiral, and around eighty dwarf galaxies, many of them orbiting one of the big two. The Local Group is gravitationally bound, which, as chapter 6 explained, means it is not expanding with the universe.
Far larger are clusters, containing hundreds or thousands of galaxies in a region a few tens of millions of light-years across. The nearest big one is the Virgo Cluster, about 55 million light-years away, containing over a thousand galaxies. Clusters are dominated by two invisible components: hot gas at tens of millions of degrees, which glows in X-rays and outweighs all the stars by a factor of about five, and dark matter, which outweighs everything else by another factor of five. The galaxies you can see are a few per cent of what is there.
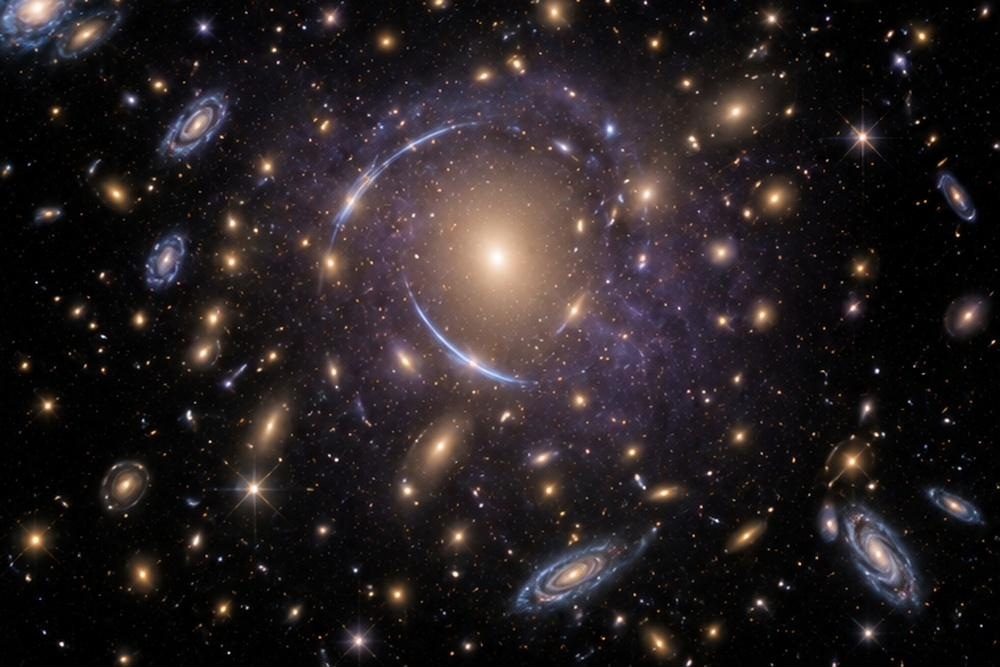
Figure F18-04. A rich galaxy cluster. The galaxies are the visible minority; most of the ordinary matter is hot gas between them, and most of the mass is dark.
Above clusters are superclusters, sprawling associations of clusters and groups that are not bound together and are being pulled apart by the expansion. Our Local Group sits on the outskirts of the Virgo Supercluster. In 2014 a team led by Brent Tully proposed a larger and more natural definition, based not on where galaxies are but on where they are going: a supercluster is the region within which all galaxies are flowing towards a common centre, like a watershed. On that definition our home structure is far larger than previously thought, about 500 million light-years across and containing perhaps a hundred thousand large galaxies. They named it Laniakea, from Hawaiian words meaning immense heaven.
KEY CONCEPT — How galaxy distances are measured now
Chapter 13 described the distance ladder used to measure the expansion rate with the greatest possible precision. Mapping millions of galaxies calls for something faster and cruder.
For any galaxy far enough away, the redshift does the job: measure the shift in its spectral lines, apply Hubble’s law from chapter 6, and you have a distance good to a few per cent, provided the galaxy is not so close that its own motion within a cluster confuses the answer. This is how redshift surveys such as DESI map structure, and it is why a galaxy map is always partly a map of time as well as space.
For the many galaxies too faint for a spectrum, astronomers use the photometric redshift: photograph the galaxy through several colour filters and match the pattern of brightnesses against templates of what galaxies look like at various redshifts. It is much less accurate, but it works on a billion galaxies at once, which is how Euclid and Rubin will operate.
For nearby galaxies, where redshift is unreliable, there are neat tricks. The faster a spiral galaxy rotates, the more luminous it is, a relation found by Brent Tully and Richard Fisher in 1977; measure the rotation and you have the true brightness, and hence the distance. For ellipticals, a similar relation links their size, brightness and the speed of their stars.
The cosmic web
Step back further still, and the largest pattern in the universe appears.
Galaxy surveys map positions in three dimensions by measuring redshifts, and when the first large ones were completed in the 1980s the result was unexpected. Galaxies are not scattered at random, nor evenly spread. They lie along filaments and sheets, which meet at dense knots where the clusters are, and between them are enormous roughly spherical voids, tens or hundreds of millions of light-years across, containing almost nothing.
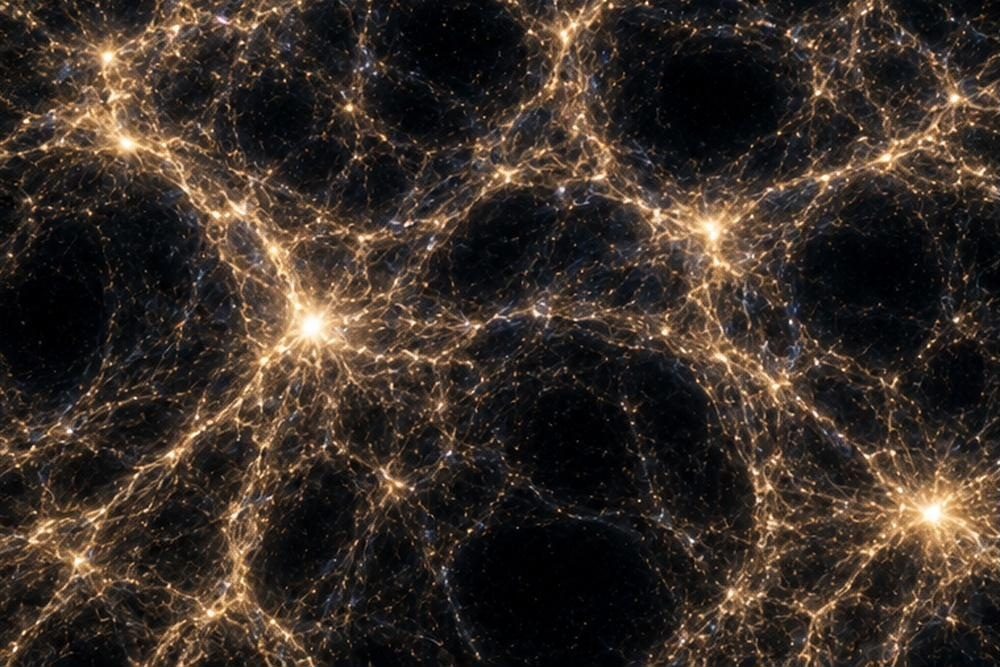
Figure F18-05. The cosmic web. Galaxies lie along filaments that meet at clusters, wrapped around immense voids. This is the largest structure in the universe, and it was built by gravity from the ripples in chapter 9.
Chapter 10 explained where the pattern came from: the faint ripples imprinted at 380,000 years, amplified by the gravity of dark matter over billions of years. Regions slightly denser than average pulled matter in and became filaments and clusters; regions slightly thinner lost matter to their neighbours and became voids. Computer simulations starting from the measured ripples produce a web statistically identical to the observed one, which is among the strongest pieces of evidence for the whole picture.
There is one more measurable consequence of all this structure, and it is close to home. The Local Group is not sitting still: it is moving at about 600 kilometres per second relative to the microwave background, which is the motion chapter 9 had to subtract before the ripples could be seen. Something is pulling us. Much of the pull comes from a dense concentration of clusters about 250 million light-years away, discovered in the 1980s and named the Great Attractor, which is awkwardly placed behind the plane of the Milky Way where dust hides it. Later surveys found that the Great Attractor is itself being pulled by something larger still, the Shapley Concentration, three times further away. On the Laniakea picture, all of this is the flow within our own watershed, and our galaxy has been falling gently towards its centre for billions of years.
KEY CONCEPT — The end of structure
There is a sensible question lurking here: does this hierarchy continue forever? Stars in galaxies, galaxies in groups, groups in clusters, clusters in superclusters. What is above a supercluster?
The answer is nothing. Above about a billion light-years, the universe becomes statistically uniform: take any box that size, anywhere, and it contains much the same amount of matter as any other. That is the cosmological principle of chapter 6, and it is now measured rather than assumed. The cosmic web is the largest structure there is, and it is the last rung of the ladder.
Occasionally a survey turns up an apparent structure larger than this limit, usually a loose arrangement of quasars or gamma-ray bursts stretching across billions of light-years, and it makes headlines. These claims are treated cautiously, because the human eye is extremely good at finding patterns in random data, and because such groupings are not held together by anything: their parts are being carried apart by the expansion and were never in contact. So far, none has survived careful statistical scrutiny well enough to overturn the uniformity of the universe on the largest scales.
Grown up too early?
Chapter 14 described JWST’s early galaxies, and this is where they belong in the story.
The standard account of how galaxies form runs as follows. Dark matter clumps first, forming small halos that merge into larger ones. Gas falls into the halos, cools, and forms stars. Small galaxies form first and merge into larger ones, which is why our own galaxy contains the shredded remains of others. Discs grow where the infalling gas has enough spin; collisions destroy discs and make ellipticals; black holes at the centres feed, blow out gas, and regulate the whole process.
That picture works well for the universe after about a billion years. The difficulty is at the very beginning, where JWST finds galaxies that are brighter, and seem more mature, than the models predicted, at ages of only two or three hundred million years. As chapter 14 explained, the resolution probably lies in the messy astrophysics of star formation rather than in cosmology: bursts of unusually efficient star formation, less dust than expected, or a different mix of stellar masses. Hundreds of spectra are being taken to decide between these.
There is also the question of how the earliest galaxies were lit. The first stars, and the first black holes, ionised the hydrogen between the galaxies over the universe’s first billion years. JWST has now found the faint galaxies that likely did most of that work, and their numbers and brightness roughly match what is needed. Chapter 20 returns to this era, because it marks the limit of what can be seen.
Where this leaves us
At the scale of this chapter the universe has a shape and a history. Galaxies are not permanent objects but assemblies, built from smaller pieces, eating their neighbours, regulated by the black holes at their hearts, and arranged along a web of filaments spun out of ripples that were imprinted when the universe was 380,000 years old.
One thing that has not appeared in this chapter is the small stuff. Every one of those hundreds of billions of stars in the Milky Way may have planets, and for most of the history in this book nobody knew whether that was true. The next chapter takes up what is, for many people, the most interesting question in astronomy: what other worlds are out there, and whether anything lives on them.
Chapter 19 — Other Worlds, Other Minds?
“Two possibilities exist: either we are alone in the universe or we are not.” — attributed to Arthur C. Clarke
The first strange worlds
For most of the history in this book, the question of whether other stars have planets was a matter of opinion. Giordano Bruno was burned in 1600 having argued, among many more dangerous things, that the stars were suns with worlds of their own. Three and a half centuries later the position had not advanced much: planets seemed likely, since the Sun had them, but nobody had seen one and nobody knew how.
The difficulty is contrast. A planet shines only by reflected light, and a star beside it is something like a billion times brighter. Looking for a planet next to its star, from light-years away, is like trying to see a moth beside a lighthouse from the other side of the country.
The first confirmed detection, in 1992, was in the strangest possible place. Aleksander Wolszczan and Dale Frail, timing a millisecond pulsar with the Arecibo telescope, found tiny regular wobbles in the pulse arrival times, and concluded that two, later three, planets were orbiting a neutron star. Nobody expected planets to exist around the burnt-out remnant of a supernova, and their origin is still debated. It was a discovery in the wrong place, and it made little public impression.
Everything changed in October 1995. Michel Mayor and Didier Queloz, at the Geneva Observatory, announced a planet around 51 Pegasi, an ordinary Sun-like star fifty light-years away. It had about half the mass of Jupiter and orbited its star once every 4.2 days, which puts it about eight times closer to its star than Mercury is to the Sun, with a surface temperature above a thousand degrees.
Nobody had predicted such a thing. Every theory of how planets form said that a giant planet must be born far from its star, where it is cold enough for ice to survive, and giant planets in our own system duly sit far out. A Jupiter in a four-day orbit was, on the accepted theory, impossible. Mayor and Queloz received the Nobel Prize in 2019, and their planet gave its type a name: the hot Jupiter.
The dip and the wobble
There are two workhorse methods, and both detect the planet by its effect on the star rather than by seeing it.
The wobble. A planet does not orbit its star; both orbit their common centre of mass, so the star traces a small circle of its own. That motion shows up as a rhythmic Doppler shift in the star’s spectrum, using the method of chapter 4. Jupiter makes the Sun move at about 12 metres per second, a walking pace, over twelve years; the Earth makes it move at 9 centimetres per second. Modern spectrographs can measure a star’s speed to within about 30 centimetres per second, which is why massive planets in close orbits were found first: they tug hardest and fastest.
The dip. If a planet’s orbit happens to lie edge-on to us, the planet passes in front of its star once per orbit and blocks a fraction of its light. The fraction is simply the ratio of areas: a Jupiter crossing a Sun dims it by about 1 per cent, an Earth crossing a Sun by 0.008 per cent, or one part in twelve thousand. Measuring that requires photometry far beyond what the atmosphere permits, which is why the great transit surveys have been space missions.
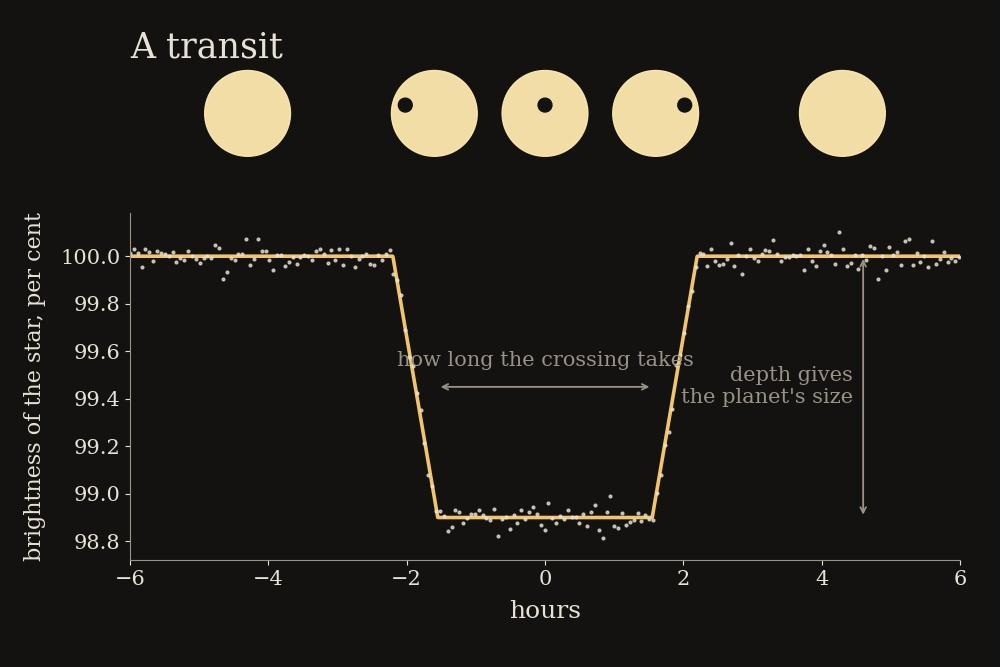
Figure F19-01. A transit. The dip is tiny, but its depth gives the planet’s size, its duration gives the orbit, and its repetition gives the year.
Transits are prized because they yield so much. The depth gives the planet’s size; combined with the wobble, which gives its mass, you get its density, and hence whether it is rock, water or gas. And when the planet passes in front, a sliver of starlight filters through its atmosphere, carrying the spectral fingerprints of whatever gases are there. That is how the air of another world is read.
NASA’s Kepler telescope, launched in 2009, stared at a single patch of sky containing 150,000 stars for four years, and found thousands of planets. Its successor TESS, launched in 2018, surveys the whole sky for planets around bright nearby stars, which are the ones worth following up. As of September 2026 the confirmed count stands at about 6,370, with thousands more candidates awaiting confirmation.
Two other methods deserve mention. Microlensing catches the brief brightening when a foreground star, with its planets, passes exactly in front of a background star and its gravity focuses the light, as in chapter 10; it is the only method sensitive to planets far from their stars and to free-floating planets that belong to no star at all, and it is one of the main tasks of the Roman telescope launched last month. And direct imaging, blocking the star’s light to photograph the planet itself, which works so far only for young, hot, massive planets far from their stars, but produces the only actual pictures.
A menagerie of planets
Thirty years of discoveries have established two things. Planets are common, and our solar system is not typical.
Statistically, most stars have planets. Small planets are far commoner than large ones. Roughly a fifth of Sun-like stars have a planet of between one and two Earth radii somewhere in the range of orbits where liquid water could exist, though that figure depends on assumptions and is much argued over.
The commonest kind of planet in the galaxy is a type we do not have: a world between the size of Earth and Neptune, one and a half to three times the Earth’s radius. These divide into two groups, super-Earths that are mostly rock and sub-Neptunes with thick gas envelopes, separated by a curious gap in the size distribution at about 1.8 Earth radii, which is thought to mark where stellar radiation has stripped away the atmosphere.
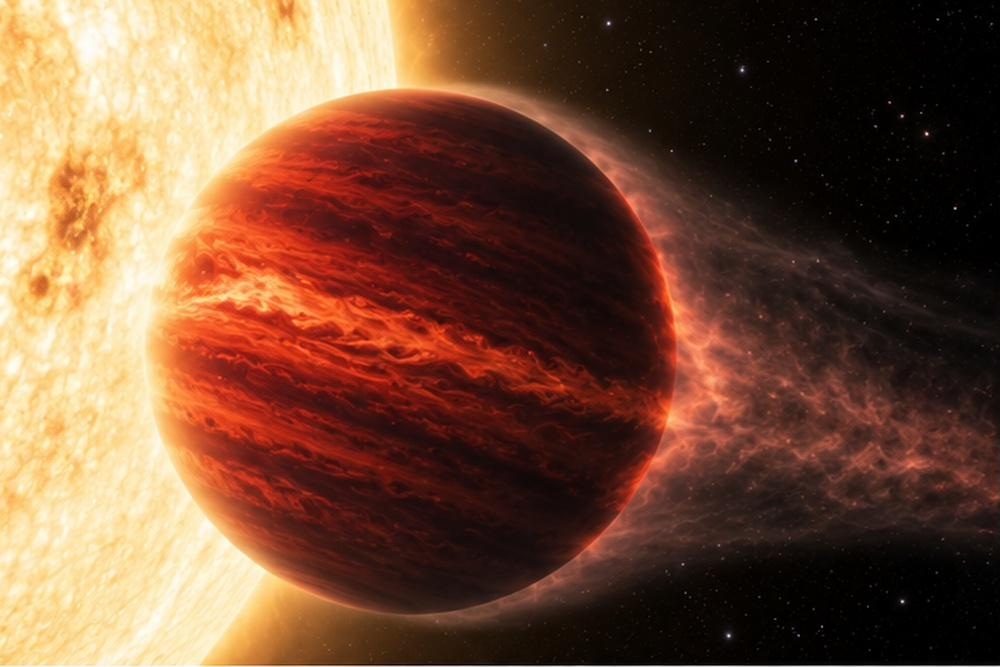
Figure F19-02. A hot Jupiter. Giant planets orbiting closer to their star than Mercury are common, were entirely unexpected, and forced a rethink of how planetary systems form.
Systems, too, are stranger than ours. Many have several planets packed inside the orbit of Mercury. Some have planets in resonant chains, where each takes a simple ratio of its neighbour’s year, evidence that the planets migrated inwards together through the disc of gas they formed in. Some orbit two stars at once. Some, the hot Jupiters, are plainly not where they were born, which is now generally explained by migration: young planets exchange energy with the disc of gas around the star and spiral inwards.
The most photogenic system is TRAPPIST-1, a small cool red dwarf forty light-years away with seven Earth-sized planets, three or four of them at distances where water could in principle be liquid. All seven would fit comfortably inside the orbit of Mercury, and from the surface of one the others would appear as discs larger than our Moon.
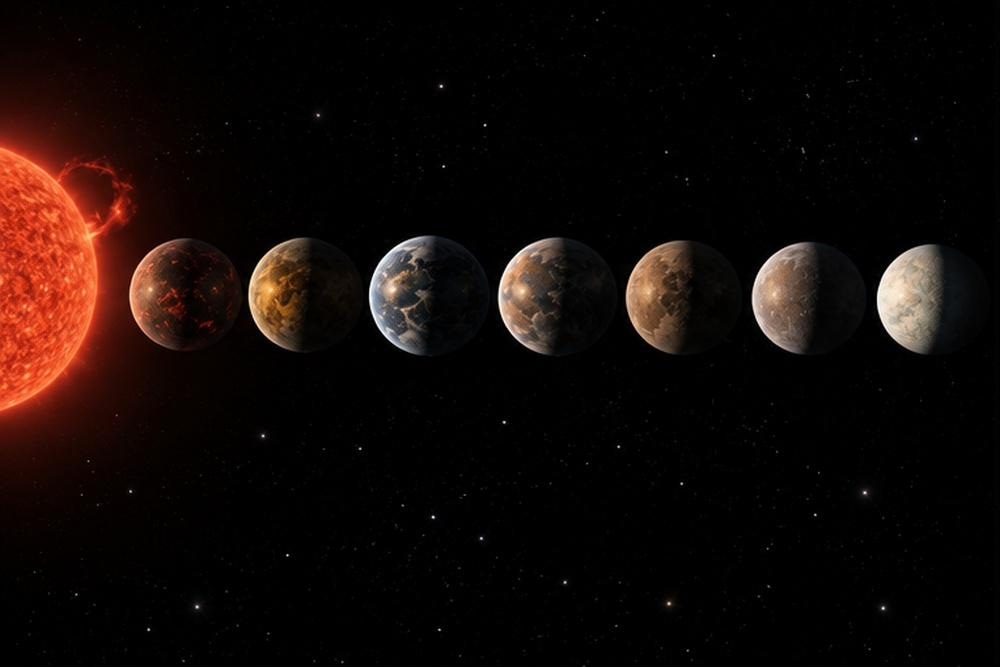
Figure F19-03. The TRAPPIST-1 system. Seven Earth-sized worlds around a dim red star, all packed within a space smaller than Mercury’s orbit.
Reading alien air
The prize is not finding planets but characterising them, and JWST was built partly for this.
Its method is transmission spectroscopy: compare the star’s spectrum during a transit with its spectrum outside one, and the difference is the fingerprint of the sliver of atmosphere the light passed through. The signal is a change of a few parts in ten thousand, and it works. JWST has measured carbon dioxide, methane, water and sulphur dioxide in the atmospheres of various planets, detected clouds and hazes, mapped the temperature difference between the day and night sides of hot Jupiters, and found evidence of winds moving at thousands of kilometres per hour.
It has also delivered the most contentious result in the field. K2-18 b is a sub-Neptune 124 light-years away, orbiting a red dwarf at a distance where its temperature might allow liquid water. In 2023 a Cambridge-led team reported methane and carbon dioxide in its atmosphere, which was itself a first for a habitable-zone planet, and a possible hint of dimethyl sulphide, a gas produced on Earth almost entirely by marine plankton. In April 2025 the same team reported a stronger hint, at about three sigma.
The reaction was instructive. Media coverage was ecstatic; the scientific response was sceptical, and NASA declined to issue a press release. Within months several independent reanalyses of the same data, including one led from NASA, concluded that the evidence for dimethyl sulphide was not there: the feature could be reproduced by other molecules, or by the choices made in modelling the atmosphere. The consensus in 2026 is that K2-18 b has an interesting atmosphere, that whether it has an ocean at all is unresolved, and that no biosignature has been detected.
This is not a story of failure. It is what a difficult measurement at the edge of an instrument’s capability looks like, and the self-correction worked exactly as it should. But it is a warning about how the first real claim of life elsewhere will be received, and how hard it will be to be sure.
KEY CONCEPT — What would count as evidence for life?
A biosignature is a substance or pattern that life produces and that nothing else plausibly does. The difficulty is the second half of that sentence.
Oxygen was long considered the gold standard, since Earth’s oxygen is almost entirely biological and it reacts away quickly without constant replenishment. Then theorists found several ways for a lifeless planet to accumulate oxygen, for example by having its water split by ultraviolet light and the hydrogen escape to space. The same has happened to most other candidates: for every proposed biosignature, somebody finds a non-living chemical route.
The likely answer is that no single gas will ever be convincing. What would be convincing is a combination that should not coexist, such as oxygen and methane together, since they destroy each other and both must be continuously resupplied, on a planet whose temperature and chemistry make abiotic explanations implausible, measured repeatedly, by different instruments, by different teams. That is a high bar, and it is the right one. A claim of life elsewhere would be the most consequential announcement in the history of science, and it will not be made on the strength of one three-sigma wiggle.
What makes a world habitable
The phrase “habitable zone” appears in every popular account, and it is worth unpacking, because it is both useful and much narrower than it sounds.
The zone is defined by one criterion: the range of distances from a star at which a planet with a reasonable atmosphere could hold liquid water on its surface. Too close and the water boils away; too far and it freezes. For the Sun that range runs roughly from just inside the Earth’s orbit to somewhere around the orbit of Mars. For a dim red dwarf it is far closer in; for a brilliant blue star, far out.
Liquid water is chosen not out of parochialism but because it is an unusually good solvent, remains liquid over a wide temperature range, and is made of two of the commonest elements in the universe. A different chemistry is conceivable, but there is no way to search for something nobody can specify.
The zone is a starting point, not a guarantee, and several complications matter. Venus and Mars both lie at or near the edges of the Sun’s habitable zone and neither is habitable. A planet’s atmosphere matters more than its distance: without its greenhouse effect the Earth would average about minus 18 degrees. Red dwarfs, which are by far the commonest stars, present particular difficulties: a planet close enough to be warm is likely to be tidally locked, with one face permanently towards the star, and young red dwarfs emit violent flares that may strip a planet’s atmosphere entirely. Whether the TRAPPIST-1 planets retain any air is one of the questions JWST is working on, and the early answers have not been encouraging.
There is also the possibility of habitats with no surface at all. The most promising places for life in our own solar system are the oceans beneath the ice of Europa and Enceladus, which lie far outside the Sun’s habitable zone and are kept liquid by tidal heating rather than sunlight. If that is the usual arrangement, the habitable zone is the wrong thing to be looking at.
The Drake equation
In 1961 the radio astronomer Frank Drake, preparing for a small meeting on the search for extraterrestrial intelligence, wrote on a blackboard a way of organising the question. It is not really an equation for calculating anything; it is a list of everything you would need to know, arranged as a chain of multiplications.
THE EQUATION — Drake’s chain
The number of civilisations in our galaxy that we could currently detect is the product of seven factors:
- the rate at which stars form in the galaxy, about two a year
- the fraction with planets, now known to be most of them
- the number of planets per system that could support life, perhaps one
- the fraction of those where life actually appears, unknown
- the fraction of those where life becomes intelligent, unknown
- the fraction of those that produce detectable signals, unknown
- the length of time such a civilisation keeps broadcasting, unknown
Multiply the first three and you get something like two new potentially habitable worlds appearing in the galaxy every year, which is a real result, and one this book’s story has established. Multiply by the last four and the answer can be made anything you like between one and millions, because four of the seven factors are pure guesses.
The equation’s value is not its answer but its structure. It converts a vague question into a list of measurable quantities, and in sixty years astronomy has measured the first three. The fourth, how often life appears where it can, is the next one within reach, and answering it is what the search for biosignatures is for.
Where is everybody?
In 1950, over lunch at Los Alamos, Enrico Fermi is said to have interrupted a conversation about flying saucers with a blunt question: where is everybody?
The point is a matter of timescales. The galaxy is about 13 billion years old and 100,000 light-years across. A civilisation with modest technology, sending out slow probes or ships that settle a system and then launch more, would spread across the whole galaxy in a few tens of millions of years, which is a tiny fraction of its age. The Earth is a relative latecomer, with billions of years of galactic history before it. If technological civilisations are at all common, somebody should have arrived here, or at least left obvious traces, long ago. We see nothing.
There is no shortage of proposed answers, and they fall into three families.
Life is rare. Perhaps the step from chemistry to biology is extraordinarily improbable, and it happened once. Or perhaps simple life is common but the step to complex cells took two billion years on Earth and usually fails. Any such “great filter” behind us would be reassuring.
Intelligence or technology is rare. Life might be common and technological civilisation vanishingly unlikely. Earth had life for four billion years and radio for a century.
They are there and we have not noticed. They may be too far away, using methods we do not monitor, deliberately quiet, or uninterested. Or the filter may lie ahead of us, and technological civilisations may typically destroy themselves, which is the least comfortable of all the options.
There is one more consideration worth stating plainly. We have searched a minute fraction of the available space. A frequently quoted 2018 analysis compared the total volume of the search so far, across all frequencies, sky positions and times, to a hot tub of water drawn from the world’s oceans. Concluding that the oceans hold no fish on that basis would be premature.
Figure F19-04. Listening. Sixty years of searching have covered a tiny fraction of the possible frequencies, directions and times, and found nothing confirmed.
Listening, and looking
The modern search takes three forms.
Radio and optical SETI listens for deliberate or accidental transmissions. The Breakthrough Listen programme, begun in 2015 with a hundred million dollars of private funding, has surveyed thousands of nearby stars with the world’s largest radio telescopes. A handful of intriguing signals have appeared and all have turned out to be terrestrial interference; one promising candidate from the direction of Proxima Centauri in 2020 was traced to faulty equipment on Earth.
Technosignatures are traces of technology rather than messages: industrial pollutants in an atmosphere, waste heat from large structures, or artificial lights. JWST could in principle detect certain industrial gases in the atmosphere of a nearby planet, and this has become a respectable line of research rather than a fringe one.
Biosignatures, the search described above, look for life of any kind rather than intelligence, and are far more likely to succeed first.
Closer to home, the solar system has several plausible habitats for microbial life: the subsurface ocean of Europa, which NASA’s Europa Clipper mission is now travelling towards; the ocean of Enceladus, whose plumes the Cassini spacecraft flew through and found organic molecules and hydrogen; the atmosphere of Venus, subject of a still-disputed claim of phosphine; and Mars, where the case is that life may once have existed rather than that it does. Finding life that arose independently, anywhere, even a microbe, would answer the fourth factor of Drake’s chain and change the whole question.
Where this leaves us
In thirty years, other worlds have gone from speculation to a catalogue of over six thousand, with more added every week. Planets are ordinary. Our own arrangement is not. Atmospheres can be analysed from light-years away, and the search for chemical evidence of life is now a funded, mainstream activity rather than a curiosity.
Nobody has found life, and nobody has heard anything. On the evidence so far, the honest position is that we do not know whether life is common or whether the Earth is a fluke, and that we now have, for the first time, the instruments to start finding out.
That closes Part III. Part IV returns to the universe as a whole, and to the three questions this book set out to answer in chapter 1: how far does it go, how does it end, and what, if anything, came before.
Part IV — Edges and Endings
Chapter 20 — Where Does It End?
“Space is big. You just won’t believe how vastly, hugely, mind-bogglingly big it is.” — Douglas Adams, 1979
Why is the night sky dark?
Part IV returns to the question chapter 1 began with, and takes it in three parts: how far the universe goes, how it ends in time, and what, if anything, lies outside or before. This chapter takes the first.
It is worth starting with a puzzle that sounds childish and is not. Why is the sky dark at night?
The obvious answer, that the Sun has set, is not an answer at all. Suppose the universe is infinite, eternal and filled with stars spread more or less evenly. Then any line you draw outwards from your eye, in any direction whatever, must eventually strike the surface of a star. The whole sky should blaze with a brightness comparable to the surface of the Sun. Distant stars look fainter, true, but by the inverse-square law of chapter 3: brightness falls off as the square of distance, while the number of stars at that distance grows as the square of distance, and the two exactly cancel. Every shell of sky contributes the same amount, and there are infinitely many shells.

Figure F20-01. Olbers’ paradox. In a deep enough forest, every line of sight ends on a trunk. In an infinite, eternal universe of stars, every line of sight should end on a star, and the sky should blaze.
Kepler noticed the problem in 1610. Others returned to it, and it became attached to the name of the German astronomer Heinrich Olbers, who wrote about it in 1823. Proposed solutions failed one after another. Dust in between would block the light, but dust heated by starlight for eternity would eventually glow as brightly as what it was blocking. Perhaps the stars are not spread evenly; but then the universe must have some structure that makes us special, which nobody wanted either.
The answer, glimpsed remarkably early by Edgar Allan Poe in a prose poem of 1848 and put on a proper footing in the twentieth century, is that the universe is not eternal. It has a finite age, and light travels at a finite speed, so we can only see out to a finite distance: the distance light has been able to travel since the beginning. Beyond that, there are presumably more stars, but their light has not arrived yet. There are not infinitely many shells contributing; there are only as many as the age of the universe allows.
The expansion helps too, by stretching and dimming the light that does arrive. But the decisive point is the age. The darkness of the night sky, which everyone has seen, is direct evidence that the universe had a beginning.
The observable universe
That gives the most important boundary in cosmology, and it is a boundary of what can be seen rather than a wall in space.
The universe is 13.8 billion years old, so the furthest anything can be from which light has reached us is set by that. The natural guess is that we can see 13.8 billion light-years in every direction, and that guess is wrong, because space has been expanding while the light was in transit.
KEY CONCEPT — The runner on a stretching track
Imagine a runner setting off towards you along a rubber track that is being stretched as she runs. She runs at a fixed speed. While she is running, the ground she has already crossed stretches out behind her, and the ground ahead stretches too.
When she reaches you, how far away did she start? Not the distance she ran. The place she started from has been carried much further away by the stretching, and is now far more distant than the length of her journey.
That is exactly the situation with light from a distant galaxy. A galaxy whose light took 13 billion years to reach us was much closer than 13 billion light-years when the light set out, and is now much further away than that, because the space in between has grown while the light was travelling. Cosmologists therefore use several different “distances” to the same object, which is why popular accounts often disagree. The two that matter are the light-travel distance, which is simply the travel time multiplied by the speed of light, and the present distance, which is where the object is now.
Work through the sums with the measured expansion history and the answer is that the most distant matter we can see, whose light we receive as the microwave background, is now about 46 billion light-years away. The observable universe is therefore a sphere about 93 billion light-years across, centred on us, and containing perhaps two trillion galaxies.
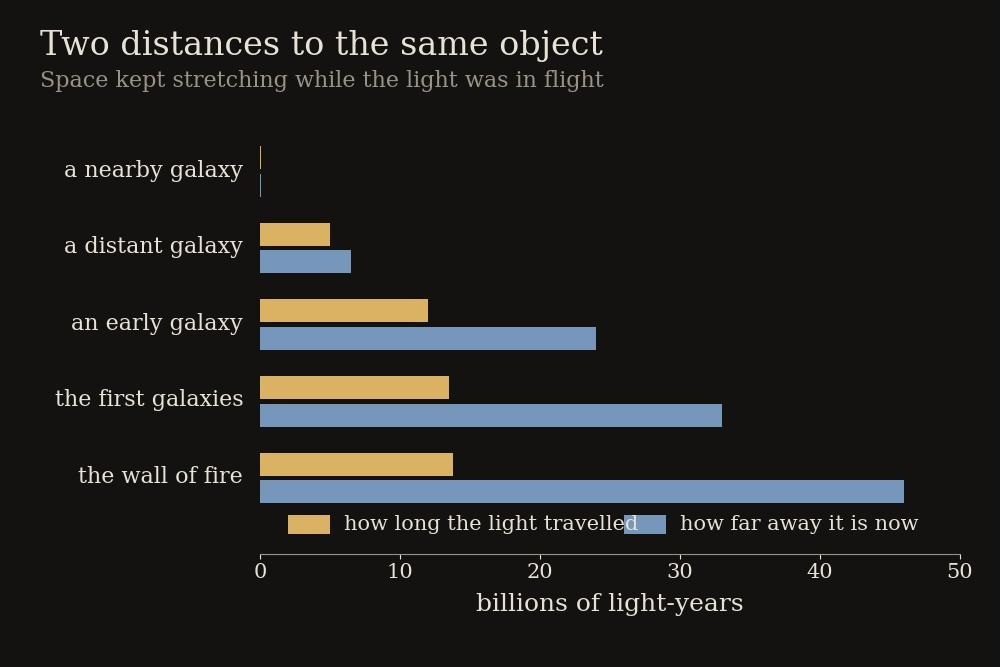
Figure F20-02. Two distances to the same object. Light from the edge of the visible universe has travelled 13.8 billion years, but the matter that emitted it is now 46 billion light-years away, carried off by the expansion.
The word “centred on us” needs care. Every observer, anywhere, has their own observable universe, a sphere of the same size centred on themselves. Ours is centred on us for the same trivial reason that the horizon at sea is centred on the ship. There is nothing special about our position; we simply cannot see past our own horizon.
The wall of fire and the last horizon
Chapter 9 introduced the surface of last scattering, and it is the practical limit of what can ever be seen with light. Look far enough in any direction and you see back to when the universe was 380,000 years old and opaque. Beyond that is fog, and no telescope will ever penetrate it.
This is a frustrating limit, but not an absolute one. Two other messengers can in principle come from earlier.
Neutrinos, which stopped interacting when the universe was one second old, are streaming past us now from that era, though catching them is far beyond current technology. And gravitational waves pass through everything, including the fog, so waves from inflation itself could in principle be detected, which is the hunt described in chapter 12. If the swirl in the polarisation of the microwave background is ever found, it will be a message from 10⁻³⁵ seconds, arriving through a wall that light cannot cross.
No centre, no edge
So the observable universe has a boundary, which moves outwards as time passes and light from further away arrives. Does the universe itself have an edge?
Almost certainly not, and it is worth being clear about what that means, because the usual mental picture, of a ball of galaxies flying outwards into surrounding emptiness, is wrong in every particular.
There are two ways for something to have no edge. It can be infinite, going on forever in every direction. Or it can be finite but unbounded, curving back on itself like the surface of a sphere, where you can travel forever without reaching a boundary and without ever finding a centre. Ants on a beach ball would report a world with a definite area, no edge and no privileged point.
Chapter 9 measured which case applies, or tried to. Space is flat to within about half a per cent, and a perfectly flat universe of the simplest kind is infinite. But a measurement of flatness to within half a per cent is also consistent with a very slight curvature, which would make the universe finite but far larger than the part we see: at least hundreds of times the diameter of the observable universe. So the honest answer is that the universe is either infinite or enormous, and no measurement can currently distinguish them.
Could space wrap around?
There is a third possibility, and it is a strange one. A universe can be flat and still finite, if it wraps around.
Think of the screen in an old arcade game where a ship leaving the right edge reappears on the left. Its space is flat, its area is finite, and it has no edge. Mathematically, the surface is a torus. Three-dimensional space can be built the same way: travel far enough in a straight line and you return to where you started, having never turned.
If our universe were like this, and if the wrap-around distance were smaller than the observable universe, there would be a striking consequence. We would see the same objects more than once, from different directions and at different ages, like being in a hall of mirrors. In particular, the sphere of the microwave background would intersect itself, producing matched circles: two rings, in different parts of the sky, showing an identical pattern of hot and cold spots.
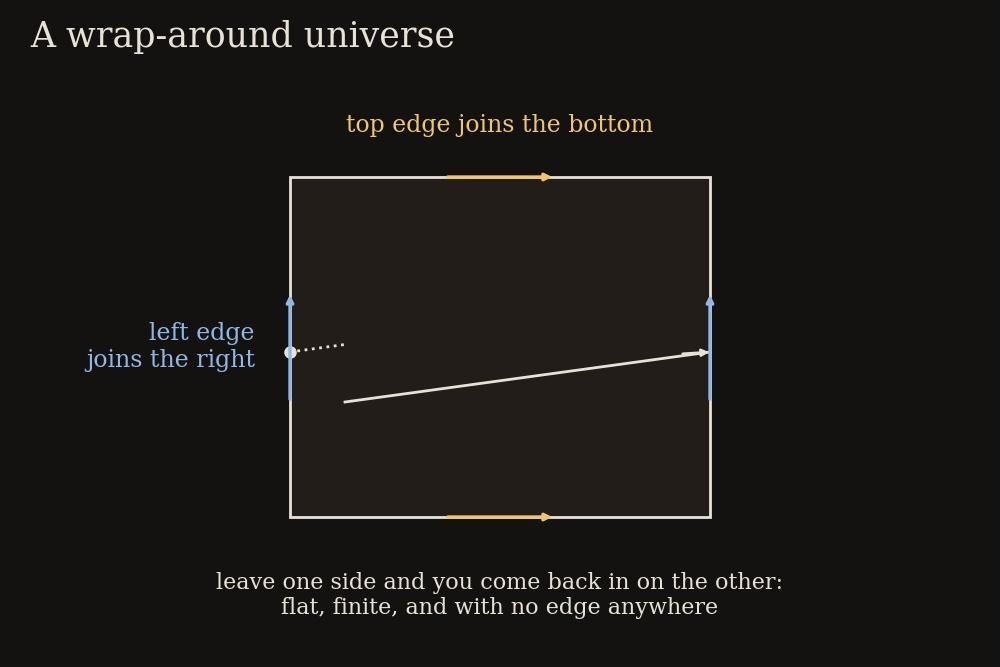
Figure F20-03. A wrap-around universe. A space can be flat, finite and without edges if it joins onto itself, in which case travelling far enough in a straight line brings you home.
Astronomers have searched the microwave sky for matched circles and found none. The searches rule out any simple wrap-around smaller than roughly the observable universe. The universe might still be finite on a larger scale, or wrapped in a more complicated way, and the question is revisited occasionally as better data arrive, but at present there is no evidence for it.
Beyond the horizon
What is beyond the observable universe? By definition we cannot know, but there is a reasonable expectation and a reason for it.
The expectation is: more of the same. The cosmological principle of chapter 6 says that on large scales the universe looks the same everywhere, and everything observable supports it: the microwave background is uniform to one part in a hundred thousand across the whole sky, and the density of galaxies is the same in every direction. It would be perverse for that uniformity to extend precisely to the edge of what we happen to be able to see and then stop.
Inflation gives a reason. Chapter 12 explained that inflation stretched a tiny patch to at least the size of the observable universe, and probably very much larger. On most versions the inflated region is larger by many powers of ten, which would mean that the universe we can see is a small piece of a vastly larger region with the same properties throughout.
There is also a more radical possibility, taken seriously by many cosmologists, that far beyond our horizon conditions are quite different, because inflation ended at different times in different places and produced regions with different properties. That is the multiverse, and chapter 22 deals with it.
The shrinking view
There is one more thing to say about the horizon, and it is the least intuitive result in this chapter. The observable universe is growing, but the part of it we can ever interact with is shrinking.
Because the expansion is accelerating, as chapter 11 described, distant galaxies are receding ever faster. Beyond a certain distance, the recession is faster than light. This breaks no rule: nothing is moving through space at that speed, but space itself is stretching, and there is no limit on that.
A galaxy whose recession rate exceeds the speed of light can still be seen, because light it emitted long ago, when it was closer, is still arriving. But light it emits today will never reach us. The space between will grow faster than the light can cross it. That galaxy has passed beyond our event horizon: it remains visible in the past tense, and is permanently unreachable.
The event horizon of our universe currently lies at about 16 billion light-years, well inside the 46-billion-light-year edge of what we can see. Of the two trillion galaxies in the observable universe, the overwhelming majority are already beyond it. We can look at them, and nothing we ever do will affect them, nor they us.
Worse, the horizon is closing. As the acceleration continues, more and more of what is currently visible passes beyond it. Chapter 21 follows this to its conclusion, which is that in the very far future an astronomer in our merged galaxy will see nothing outside it at all, and will have no way of discovering that the universe is expanding.
KEY CONCEPT — The two horizons
It is easy to confuse these, and they are different.
The particle horizon, at about 46 billion light-years, is the edge of what we can see: the furthest matter whose light has had time to reach us since the beginning. It grows with time, because light from ever more distant places keeps arriving.
The event horizon, at about 16 billion light-years, is the edge of what we can ever influence or be influenced by: the furthest place from which light emitted today will ever reach us. It is shrinking in the long run, because of acceleration.
We live in the brief cosmic era when the two are comparable, and when the universe is both large and knowable. Earlier, there was less to see. Later, there will be far less.
What “infinite” would actually mean
If the universe is infinite, some odd consequences follow, and they are worth facing because they are often stated carelessly.
The first is that everything possible happens somewhere. If space is infinite and filled with matter arranged with the randomness that inflation predicts, then any arrangement of atoms that has a non-zero chance of occurring will occur, somewhere, and in fact infinitely often. That includes an exact copy of the Earth, and of you, reading this sentence. Physicists have even estimated how far away the nearest duplicate would be, and the number is unimaginably large, a one followed by about 10²⁹ zeros of metres.
This argument is logically respectable and should be treated with caution all the same. It assumes that the universe is genuinely infinite rather than merely enormous, that matter really is distributed at random on the largest scales, and that the laws and constants of physics are identical everywhere. Each of those is an extrapolation far beyond anything that can be tested, and an argument that relies on three untestable assumptions is entertainment rather than science, however rigorous the mathematics.
The second consequence is more practical. If the universe is infinite, it was infinite at the moment of the Big Bang too. This is one of the commonest misunderstandings about cosmology: the Big Bang was not a small object in a large space. Chapter 7’s box made the point, and infinity sharpens it. An infinite universe that expands remains infinite; what changes is the distance between things in it. The early universe was not small; it was dense. The part of it that has become our observable universe was small, and that is a different statement.
The farthest thing we have seen
At the practical frontier, the record for the most distant confirmed galaxy has been broken repeatedly since JWST began observing. The current holders date from around 280 to 300 million years after the beginning, which is about two per cent of cosmic history, and their light has been stretched by a factor of roughly fifteen, so what left the galaxy as ultraviolet arrives as infrared, invisible to the eye and to Hubble, which is why JWST was built to see in the infrared.
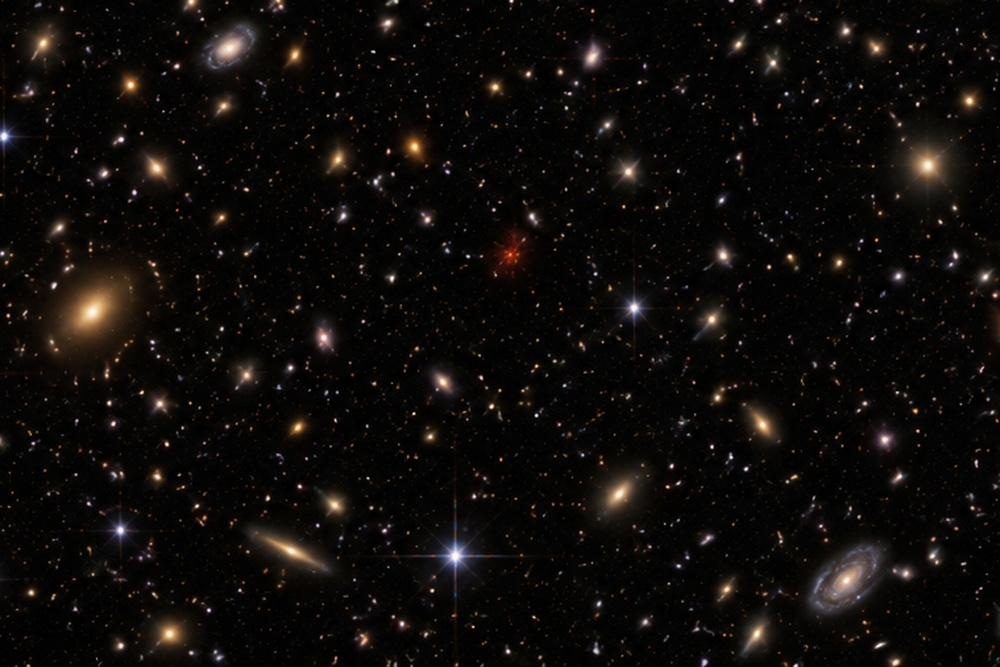
Figure F20-04. The current frontier. The faintest red smudges in JWST’s deep fields are galaxies seen as they were less than three hundred million years after the beginning.
Beyond those galaxies lie the dark ages, described in chapter 8, which contain nothing that shines and will be mapped, if at all, by the radio hydrogen signal that chapter 14 described. Beyond that is the wall of fire. That is the shape of the visible past: a few hundred million years of galaxies, a long dark gap, and then a glowing wall.
THE EQUATION — The observable universe shrunk to the size of the Earth
A sphere 93 billion light-years across is not something anyone can picture, so scale it down. Shrink the whole observable universe until it is the size of the Earth, which means dividing every length by about 10²⁰.
On that scale:
- The Milky Way, 100,000 light-years across, becomes about 14 metres: a large house.
- The Local Group becomes about 1.4 kilometres across.
- The Virgo Cluster lies about 7 kilometres away.
- The whole Laniakea supercluster of chapter 18 is a region about 70 kilometres across, the size of a county.
- The solar system out to Neptune is about a tenth of a micrometre: the size of a virus.
- The Sun itself is about two hundredths of a nanometre across, which is smaller than a single hydrogen atom.
So on a model of the universe the size of the Earth, our galaxy is a house, our supercluster is a county, and the Sun is smaller than an atom.
Where this leaves us
The universe has no edge, no centre, and no outside. What it has is a horizon, which belongs to the observer rather than to the universe, and which sits at about 46 billion light-years. Within it are perhaps two trillion galaxies. Beyond it is almost certainly more of the same, on a scale at least hundreds of times larger and possibly infinite.
Chapter 1 ended with Ptolemy’s universe, closed and finite, ending at the sphere of the fixed stars about a hundred million kilometres away. Nineteen chapters later the answer to the same question is that the universe probably does not end at all, and that the limit is not in the universe but in us: in the age of the light, and the speed it travels.
Space, then, has no end. Time is a different matter, and the next chapter takes it up: how the universe ends, and how long that will take.
Chapter 21 — How It All Ends
“This is the way the world ends, not with a bang but a whimper.” — T. S. Eliot, 1925
Reading the future
Predicting the future of the universe is, oddly, easier than predicting next week’s weather. Weather is chaotic, and small errors grow. The universe on the largest scales is simple: a smooth distribution of matter and energy, governed by gravity and the expansion, with no room for surprises of the everyday kind.
There are two catches. The first is that everything depends on one number, the behaviour of dark energy, which chapter 11 showed is not yet settled. The second is that the timescales become so long that they stop meaning anything. This chapter uses powers of ten throughout, and it is worth pausing on what they do. A trillion years is 10¹². The numbers in the later sections run to 10¹⁰⁰ years and beyond. Each step of one in the exponent multiplies the time by ten, so 10¹⁰⁰ is not a hundred times 10⁹⁸, it is ten thousand times. By the end of the chapter the present age of the universe, 1.38 × 10¹⁰ years, will look like an instant, because it is.
The chapter takes the standard picture first, in which dark energy is a cosmological constant and the expansion accelerates forever. Then it takes the alternatives.
The Sun’s last act
Begin close to home, on a timescale that is almost comprehensible.
The Sun is getting brighter. As it fuses hydrogen into helium, its core slowly contracts and heats, and its output rises by about one per cent every hundred million years. In roughly a billion years the Earth will receive enough extra heat that the oceans begin to evaporate in earnest, water vapour will amplify the warming, and the planet will become uninhabitable for anything resembling present life. This is worth stating plainly: the Earth’s habitable phase ends not in five billion years but in about one, and we are perhaps four-fifths of the way through it.
In about five billion years the Sun’s core hydrogen runs out and it becomes the red giant of chapter 15, swelling to something like a hundred times its present size. Mercury and Venus are certainly engulfed. The Earth’s fate is genuinely uncertain: the Sun will lose mass as it swells, so the Earth’s orbit will widen, and the calculation is finely balanced between escaping and being swallowed. Either way the surface will be molten.
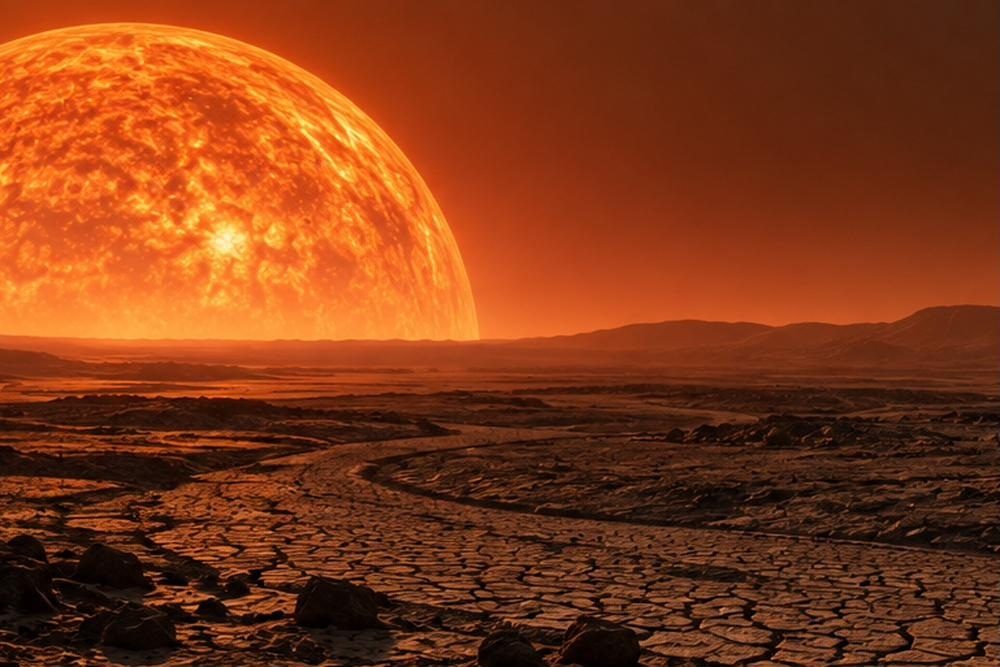
Figure F21-01. The Sun as a red giant. In about five billion years it will swell to a hundred times its present size; long before that, the Earth’s oceans will have gone.
After a few hundred million years as a giant, the Sun sheds its outer layers as a planetary nebula and leaves behind a white dwarf about the size of the Earth, which will cool slowly through white, yellow and red over tens of billions of years.
Meanwhile, as chapter 18 described, the Milky Way and Andromeda may or may not merge, with recent work putting it at about even odds over the next ten billion years. If they do, the merged galaxy will settle into a large elliptical, and any observers then will see an unfamiliar sky.
The lonely sky
Now the effect of accelerating expansion begins to dominate, and it does something that no other process in this book does: it removes evidence.
Chapter 20 explained that galaxies beyond our event horizon can still be seen but can never be reached. As the acceleration continues, they also stop being seen. Their light is stretched to ever longer wavelengths and its rate of arrival slows, so that each galaxy fades and reddens towards invisibility rather than vanishing abruptly. In about 150 billion years all galaxies outside our own gravitationally bound group will have faded beyond detection.
What remains is the Local Group, merged into one large elliptical galaxy, floating in apparently empty space. The microwave background will still be there, but stretched so far that its wavelength exceeds the size of the observable universe, making it undetectable by any means.
KEY CONCEPT — A universe that hides its own history
Consider astronomers on a planet around some star in that merged galaxy, a hundred billion years from now. They are as clever as we are and have the same laws of physics.
They see one galaxy, their own, surrounded by absolute darkness. There are no other galaxies to observe, so there is no Hubble’s law to discover and no evidence of expansion. There is no microwave background, so there is no wall of fire, no measurement of the early universe, no evidence of a hot beginning. The light elements will have been thoroughly reprocessed by generations of stars, so even the helium abundance will not give the game away.
Their best possible cosmology will be a single, eternal, static island of stars in an infinite void, which is roughly what Kapteyn believed in 1920. Everything in Part II of this book will be not merely unknown but unknowable, with no experiment capable of revealing it.
That is a sobering thought about our own position. We happen to live at a moment when the universe’s history is legible, and it will not stay that way. It also raises an uncomfortable question that cannot be answered: is there something already unknowable to us, some feature of the universe whose evidence has already faded?
The last stars
Star formation in the universe peaked about ten billion years ago and has been declining since; the Milky Way now makes perhaps one or two new stars a year, down from many dozens at its peak. The decline is simply a matter of supply: gas is being locked into stars and stellar remnants faster than it is returned.
Eventually the gas runs out. Estimates put the end of star formation at somewhere around 10¹² to 10¹⁴ years, a hundred to ten thousand times the present age of the universe.
After that, the remaining stars simply run down, longest-lived first. The Sun-like stars are long gone. What is left are red dwarfs, the frugal, dim, low-mass stars of chapter 15, which burn their fuel so slowly that they last for trillions of years. The last of them will fade around 10¹⁴ years from now.
Figure F21-02. The last stars. After about a hundred trillion years the only stars left will be dim red dwarfs, and then they too will fade.
At that point the universe contains no shining stars at all. Astronomers call the era that follows the degenerate era, because what remains are the degenerate remnants: white dwarfs cooling towards absolute zero, neutron stars, black holes, failed stars, planets, and thin cold gas.
The lights go out at about 10¹⁴ years. To put that in proportion, if the whole history of the universe so far were one second, the stellar era would end about three hours from now, and everything that follows in this chapter would take longer than the rest of this book could express.
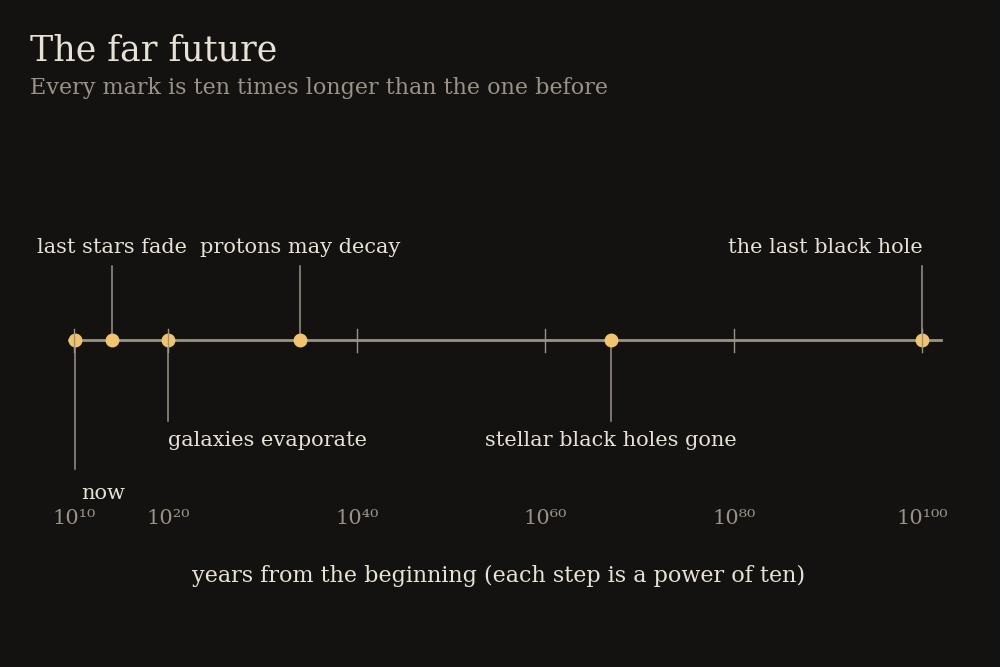
Figure F21-05. The far future on a scale where every step is ten times longer than the last. The whole history of the universe so far sits at the extreme left.
The long twilight
For an unimaginably long stretch after that, the universe is dark, cold and almost static, and the processes that matter are ones that are far too slow to notice today.
Gravitational encounters slowly rearrange everything. When two objects pass, one can gain energy at the other’s expense, so over long enough times galaxies evaporate: most of their remnants are flung out into intergalactic space, while the rest sink to the centre and are eventually swallowed by the central black hole. Estimates put galactic evaporation at around 10¹⁹ to 10²⁰ years.
Orbits also decay by gravitational radiation, the process of chapter 16, which is normally negligible but has all the time in the world. Planetary orbits spiral in over something like 10²⁰ years.
Then comes an open question with a very large consequence: whether protons last forever.
Some theories that unify the forces of nature predict that a proton can decay, with a lifetime of perhaps 10³⁴ years. Enormous underground detectors, watching tanks of water containing more protons than there are stars in a million galaxies, have looked for a single decay and found none, which pushes the lifetime above about 10³⁴ years. Protons may be perfectly stable, and nobody knows.
If they do decay, then at around 10³⁴ to 10⁴⁰ years all ordinary matter dissolves. White dwarfs, neutron stars, cold planets and any remaining gas evaporate into radiation and light particles. The universe is left containing only black holes, radiation and a thin haze of electrons and their antiparticles.
If protons are stable, the process is slower and stranger. Cold matter still rearranges itself over spans like 10¹⁵⁰⁰ years, by quantum tunnelling, so that any lump of matter eventually becomes iron, the most stable nucleus, and every remaining object is a sphere of iron. Over far longer times again, those spheres collapse into black holes.
The age of black holes
Either way, black holes inherit the universe, and they too are temporary.
Chapter 17 described Hawking radiation: a black hole glows faintly, and the smaller it is the hotter it glows. Today the microwave background is warmer than any stellar-mass black hole, so black holes absorb more than they emit and are slowly growing. Once the background has cooled below their temperature, which happens in the far future, evaporation takes over.
The lifetime depends steeply on mass, as the cube of it. A black hole of a few solar masses evaporates in about 10⁶⁷ years. One of a million solar masses takes about 10⁸⁵ years. The largest, of a hundred billion solar masses, last about 10¹⁰⁰ years.
Each ends the same way. As it loses mass it heats up, so it radiates faster, so it loses mass faster, and the final stage is a rapid burst of increasingly energetic radiation: after an almost endless quiet decline, a flash.
Figure F21-03. The last event. A black hole evaporates ever faster as it shrinks, ending in a brief burst. The largest will take 10¹⁰⁰ years to reach that point.
Heat death
After the last black hole has evaporated, at some time around 10¹⁰⁰ years, the universe contains an extremely thin, cold, expanding soup of photons, neutrinos, electrons and positrons, drifting apart forever.
Nothing further happens. The temperature approaches absolute zero without reaching it, the density approaches zero, and there are no energy differences left to drive any process. This state is called the heat death, and the name is misleading: it is the death of heat, not death by heat.
KEY CONCEPT — Entropy, and why the universe runs down
The underlying principle is the second law of thermodynamics, which is worth stating in plain terms because it governs everything in this chapter.
Energy is never lost, but it becomes less useful. A hot cup of tea in a cold room can drive a small engine; once the tea and the room reach the same temperature, the same total energy is still present but can drive nothing. The measure of that uselessness is called entropy, and it always increases in any closed system.
Everything interesting that happens anywhere, including every living thing, runs on differences: hot against cold, dense against thin, ordered against disordered. Stars exist because gravity concentrated matter into hot lumps in a cold sky. Life on Earth exists because a hot Sun shines on a cold planet and we intercept a little of the flow.
The universe began in a state of unusually low entropy, which is itself one of the deepest puzzles in physics, and it has been running down ever since. The heat death is simply the end of that process: no differences left anywhere, and therefore nothing that can happen. Not destruction, but stillness.
The Big Rip
That is the standard picture. It holds if dark energy is Einstein’s cosmological constant, with the number w from chapter 11 sitting at exactly minus one forever. Now the alternatives, which chapter 11’s hints make live possibilities rather than academic ones.
If w is less than minus one, dark energy grows stronger as space expands, rather than staying constant. This is called phantom dark energy, and it ends the universe far sooner and far more violently.
In a Big Rip, the repulsive force increases without limit. As it does, it overwhelms gravity and then the other forces, in order of the scale they operate on. Galaxy clusters are torn apart first, then galaxies, then solar systems, then planets and stars, and finally atoms and nuclei, each shredded in the last moments before the end. The whole universe ends at a definite time, in a singularity of infinite expansion.
Published estimates, using the data available in the mid-2020s, put the earliest plausible Big Rip at a few tens of billions of years from now, if w turns out to be meaningfully below minus one. Current measurements sit very close to minus one, and the DESI hints described in chapter 11 point, if anything, the other way, towards dark energy weakening rather than strengthening. So the Big Rip is at present the least favoured of the three fates, but it has not been excluded.
The Big Crunch returns
The third possibility is the oldest. If the expansion stops and reverses, everything falls back together.
For most of the twentieth century this was one of the two standard options, decided by whether the universe contained more or less than the critical density. The discovery of dark energy appeared to rule it out: a cosmological constant never weakens, so the expansion can never be reversed.
That conclusion depends entirely on dark energy being constant. If it is weakening, as the DESI results hint, then the possibilities reopen. Dark energy could fade to nothing, leaving a universe that coasts and eventually recollapses under gravity; or it could pass through zero and become negative, an attractive rather than repulsive influence, which would bring on a collapse much sooner. Several groups have published estimates along these lines since 2024, with total lifetimes in the region of twenty to thirty billion years, which would mean the universe is already middle-aged.
A collapse would run the film backwards. Galaxies would approach rather than recede, the microwave background would blueshift and warm, the sky would brighten, and eventually everything would be compressed into a hot dense state resembling the first minutes of chapter 8. Whether that is an ending or a bounce into a new expansion is a question for chapter 22.
These estimates rest on a three-sigma hint and on particular ways of modelling how dark energy might change. They should be treated as one live possibility among several, not as a forecast.
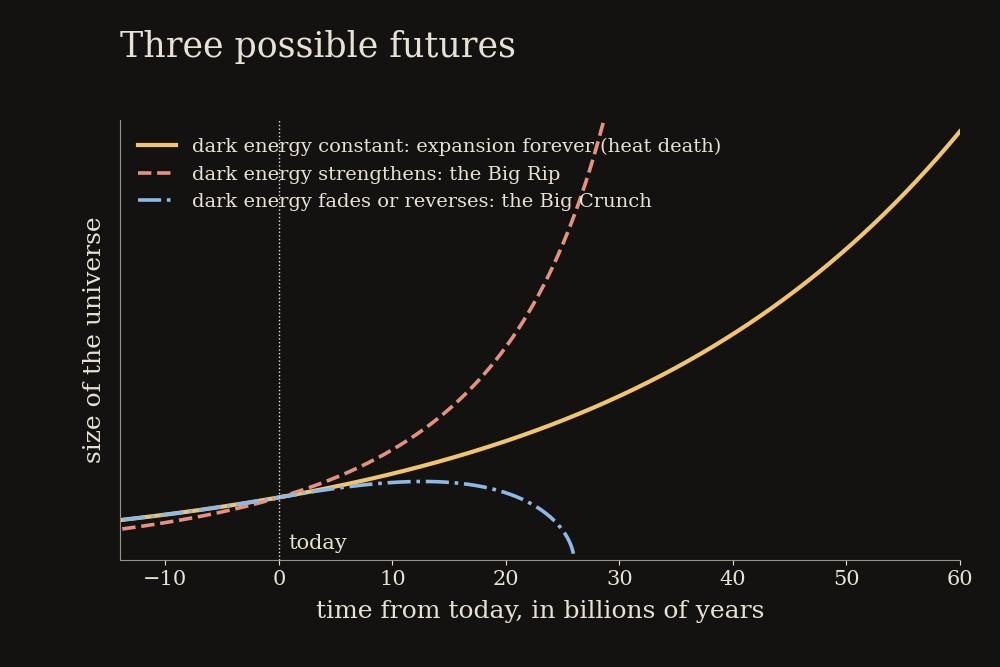
Figure F21-04. Three fates. Which one applies depends on how dark energy behaves, which is the question the surveys of chapter 14 are built to answer.
The vacuum question
There is one more possibility, unlike the others in that it could happen at any moment.
Chapter 12 described the false vacuum: a state of space that is not the lowest possible energy but is stable enough to persist. Measurements of the Higgs particle at CERN, combined with the mass of the top quark, suggest that our vacuum may be in exactly such a state: not the true minimum, but a shallow dip, separated from a deeper one by a barrier.
If so, quantum mechanics allows a small region to tunnel through the barrier and reach the true vacuum, forming a bubble that would then expand at the speed of light, converting everything it swept over into a state with different physical laws in which atoms could not exist. There would be no warning, since the bubble wall travels as fast as any possible signal.
Two things should be said about this. The first is that the calculation is at the limit of what current physics can support, and depends on there being no new physics at high energies, which there almost certainly is. The second is that the estimated timescale is enormous, far longer than the lifetimes of the black holes above, so on any reasonable reading the vacuum is stable for practical purposes. It is a curiosity rather than a worry, but it is a genuine one, and it is the only entry on this list that has no advance notice.
What this means, if anything
A chapter about the end of everything tends to prompt the question of whether any of it matters, and it deserves a straight answer rather than a consoling one.
Every fate described here lies at least a billion years away, which is longer than complex life has existed on Earth, and most of them lie beyond timescales that any number system makes meaningful. Nothing in this chapter has the slightest bearing on any human decision.
What it does offer is perspective of a particular kind. The universe had a beginning, is in the middle of a long and eventful phase, and will end in stillness. The interesting part, the era of stars and galaxies and chemistry and possibly of observers, is a brief episode near the start, and we are in it. On the cosmic calendar of chapter 8, the stellar era occupies the first few hours of the year; everything after is 10¹⁰⁰ years of cooling dark. Being alive during the bright part, and able to work out that it is the bright part, is an odd distinction.
Where this leaves us
The most likely future, on present evidence, is a slow one: galaxies fading from view, star formation ending in about a hundred trillion years, matter dissolving, black holes evaporating over 10¹⁰⁰ years, and a cold, thin, silent expansion thereafter. The alternatives, a rip or a crunch, depend on whether dark energy is constant, which is the single most consequential open question in cosmology and is expected to be much better constrained within a decade.
That is the end. One question remains, and it is the one chapter 8 deferred: what, if anything, came before the beginning. The last chapter takes it up, along with the multiverse, the limits of what science can test, and the question of why the universe is the way it is at all.
Chapter 22 — Before the Beginning
“The most incomprehensible thing about the world is that it is comprehensible.” — Albert Einstein, 1936
What the Big Bang does not say
This book has one question left, and it is the one people ask first: what happened before the Big Bang, and why is there a universe at all?
Start by clearing away a misunderstanding that chapter 7 introduced and that is worth repeating here, because everything in this chapter depends on it. The Big Bang theory is not a theory of the origin of the universe. It is an account of how the universe evolved from a hot, dense early state, and its evidence, the expansion, the light elements, the microwave background, all concerns what happened afterwards. It says nothing whatever about how that state came about.
Ask a cosmologist what happened before the Big Bang and the honest answer is that nobody knows, that the question may not even be well posed, and that there are several serious proposals, none of which can currently be tested. This chapter sets out those proposals as fairly as it can, and is clear about which parts are science and which are not yet.
Where the theory breaks
Run the expansion backwards in general relativity and the universe gets smaller, denser and hotter without limit. At time zero the equations give infinite density, infinite temperature and zero size: a singularity.
In the 1960s Roger Penrose and Stephen Hawking proved a set of theorems showing that this is not an artefact of assuming a perfectly smooth universe. Given general relativity and reasonable assumptions about matter, a singularity in the past is unavoidable.
Almost no physicist believes the singularity was real. An infinity in a physical theory is a sign that the theory has been used beyond its range, in the way that a calculation of an ocean wave breaks down when the wave breaks. The theorems assume general relativity holds all the way back, and general relativity certainly does not hold all the way back, because as the universe becomes small enough, quantum effects take over.
The point where the handover happens is the Planck scale, named after Max Planck, who noticed in 1899 that combining the three fundamental constants of nature, the speed of light, Newton’s gravitational constant and the quantum constant, gives a unique length, time and energy.
KEY CONCEPT — The Planck scale, and why it is the end of the map
The Planck length is about 10⁻³⁵ metres. To picture the gap: an atom is 10⁻¹⁰ metres, an atomic nucleus 10⁻¹⁵, and the Planck length is 10⁻³⁵. So the nucleus is as much larger than the Planck length as the entire observable universe is larger than a grain of sand.
The Planck time, how long light takes to cross that distance, is about 10⁻⁴³ seconds.
These are not arbitrary small numbers. They are the scales at which the gravity of a single quantum fluctuation becomes strong enough to matter, so that spacetime itself should be subject to quantum uncertainty, fluctuating and perhaps losing any definite shape. General relativity treats spacetime as a smooth, definite thing; quantum mechanics says nothing is smooth and definite at small enough scales. Both theories have been tested to extraordinary precision in their own domains, and at the Planck scale they contradict each other outright.
No experiment can reach these scales. To probe the Planck length directly with a particle accelerator would require a machine something like a thousand trillion times more powerful than the Large Hadron Collider, on a scale comparable to a galaxy. This is the fundamental reason why the first instant of the universe remains unknown, and why it may stay that way.
Quantum gravity
The missing theory, which would describe gravity and the quantum together, is called quantum gravity, and building one has been the central unsolved problem in theoretical physics for over eighty years. Two main programmes exist, and the companion volume covers them in more detail.
String theory proposes that the fundamental objects are not point particles but tiny vibrating strings, with different vibrations corresponding to different particles, much as different modes of a violin string give different notes. Gravity emerges naturally from the theory rather than being added, which is its great attraction. Its difficulties are that it requires extra spatial dimensions, curled up too small to see, and that it appears to permit an enormous number of possible configurations, each giving different physical laws, with no known principle for choosing among them.
Loop quantum gravity takes the opposite approach, leaving the particles alone and quantising spacetime itself, so that space is built from discrete finite chunks about a Planck length across, woven into a network. It has produced an intriguing result for cosmology: in some versions the discreteness prevents infinite compression, so that a collapsing universe reaches a maximum density and bounces rather than reaching a singularity.
Neither theory has made a prediction that has been tested. That is not for lack of effort, and it is the central frustration of the field.
Bubbles and the multiverse
The most-discussed proposal about the beginning comes not from quantum gravity but from inflation itself, and chapter 12 flagged it.
In most versions of inflation, the process does not stop everywhere at once. Quantum fluctuations mean that inflation ends in some regions while continuing in others, and because inflating regions double in size repeatedly while non-inflating ones do not, the inflating part always outgrows the rest. Inflation, once started, never entirely stops. This is called eternal inflation.
The picture that results is of an endlessly inflating background in which bubbles of non-inflating space continually form, each one a “pocket universe” undergoing its own hot Big Bang and expanding forever afterwards. Our entire observable universe would be the inside of one such bubble, and the bubbles are carried apart by the inflating space between them faster than light can cross it, so they can never meet or be observed.
Figure F22-01. Bubble universes. In eternal inflation, regions stop inflating at different times and become separate universes, carried apart forever by the space between them.
If string theory is right that physical laws can settle into an enormous number of configurations, then different bubbles could have different constants of nature: different particle masses, different strengths of the forces, perhaps different numbers of dimensions. The combination of eternal inflation and the string landscape is what most physicists mean by the multiverse.
KEY CONCEPT — Is the multiverse science?
This is argued about fiercely, and both sides have a case.
Against. A theory that cannot be tested is not science. Other bubbles are permanently unobservable, in principle and not merely in practice. Worse, if every possible outcome occurs somewhere, the theory predicts nothing: any observation is consistent with it. Critics including Paul Steinhardt and the cosmologist George Ellis have argued that accepting such ideas weakens the standard of evidence that makes physics work.
For. The multiverse is not a theory proposed to explain anything; it is a consequence of two theories, inflation and quantum field theory, that were developed for other reasons and have passed their own tests. Nobody chose it. If a well-tested theory implies something unobservable, that implication does not become unscientific by being inconvenient. Black hole interiors are unobservable too.
The fair summary is that eternal inflation is a prediction of testable theories, and the multiverse is a consequence that cannot itself be tested directly. There have been attempts at indirect tests, most notably searching the microwave background for a circular bruise left by a collision with a neighbouring bubble. None has been found.
Bounces and cycles
The alternative family of ideas dispenses with a beginning altogether.
The oldest version is a cyclic universe: expansion, collapse, bounce, expansion again, forever. It fell out of favour when it was realised that entropy from chapter 21 would accumulate from cycle to cycle, so the cycles could not have been going on forever, and when dark energy appeared to rule out collapse.
Modern versions get around this. Paul Steinhardt and Neil Turok proposed a cyclic model in which each cycle is driven by dark energy diluting the previous cycle’s entropy before a slow contraction, so the cycles can continue indefinitely. Roger Penrose’s conformal cyclic cosmology takes a stranger route: he argues that in the far future, when the universe contains nothing but radiation and all mass has evaporated, there is no way to measure size or time at all, so that state is mathematically equivalent to the hot dense beginning of a new aeon. Penrose has claimed to see traces of the previous aeon in the microwave background, in the form of faint concentric rings; other groups have analysed the same data and found nothing convincing.
Loop quantum cosmology, mentioned above, produces a bounce naturally: the universe contracts to a maximum density and rebounds. In such models there was a previous universe, contracting, and our expansion is the continuation of it.
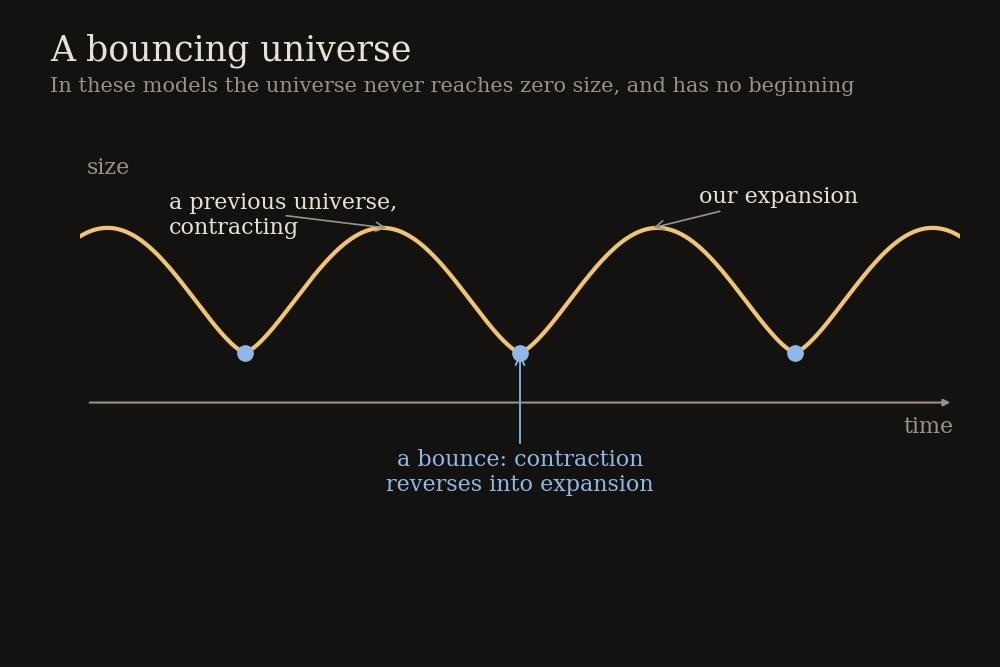
Figure F22-02. A bouncing universe. In some models the universe never reaches zero size: contraction reverses into expansion, and what we call the beginning is a continuation of something earlier.
No boundary
There is a third option, and it is the most conceptually radical: that the question “what came before?” has no answer, not because we cannot find it but because there is no “before”.
In 1983 James Hartle and Stephen Hawking proposed what is called the no-boundary condition. In their treatment, as you approach the earliest moments, time gradually loses its distinctness from space, so that instead of a sharp starting instant there is a smooth, rounded region with no edge.
Hawking’s analogy was the South Pole. Walking south on the Earth’s surface, you eventually reach the pole, and there is nowhere further south to go. Not because there is a barrier, but because the question stops making sense at that point: the surface is perfectly smooth there, with no boundary and no edge. In the same way, he suggested, asking what happened before the beginning of time is like asking what lies south of the South Pole.
Whether this is profound or a sleight of hand is still debated, and the mathematics has been challenged. But it makes the useful point that “before” is a concept that belongs to time, and if time itself began, the concept may simply not apply.
A universe fit for us?
There is one more question that tends to be raised at this point, and it has an uncomfortable relationship with the multiverse.
Several constants of nature look finely balanced. If the strong nuclear force were a few per cent weaker, the carbon resonance that chapter 7 described would not work and there would be little carbon. If the cosmological constant were substantially larger, the universe would have flown apart before galaxies could form. Change various numbers slightly and you get a universe with no chemistry, no stars, or no structure at all.
Three responses are on offer.
Coincidence. The constants have the values they have; we are impressed because we are here to be impressed. Some of the claimed fine-tunings also loosen considerably when several constants are allowed to vary together.
Necessity. A deeper theory, when found, will show that the constants could not have been otherwise. This is what most physicists have historically hoped for.
Selection. If there are many universes with different constants, then observers can only arise in the rare ones where the constants permit it, so finding ourselves in such a universe is no more surprising than finding ourselves on a planet with a breathable atmosphere. This is the anthropic argument, and its force depends entirely on whether the other universes exist, which brings us back to the previous section.
The anthropic argument is often dismissed as a cop-out, and it is worth noting that it has been used successfully once. In 1987 Steven Weinberg argued that if a multiverse existed, the cosmological constant should be observed to be small but not zero, because a much larger value would prevent galaxies and a value of exactly zero would be a coincidence. Eleven years later dark energy was discovered with roughly the value he had indicated. That is not proof, but it is the only anthropic prediction that has come off, and it deserves mentioning alongside the objections.
Why is there anything?
Beneath all of this sits the oldest question of the lot, usually phrased as: why is there something rather than nothing?
Physics has made two kinds of attempt at it, and it is worth being clear about how far each gets.
The first is the observation that “nothing” is harder to arrange than it sounds. In quantum theory, empty space is not empty, as chapter 11 described: it seethes with fluctuations, and it has energy. Several physicists, notably Lawrence Krauss, have argued that a universe can arise from such a vacuum by a quantum fluctuation, and that the total energy of the universe may in fact be close to zero, because the energy of matter is positive while gravitational energy is negative, and the two may cancel. On that accounting, creating a universe costs nothing, and the question becomes why it would not happen.
The obvious objection, made forcefully by philosophers, is that a quantum vacuum with laws of physics governing it is not nothing. It is a very particular and highly structured something. The argument explains how a universe might arise given quantum mechanics, which is a real achievement, and leaves untouched the question of why there is quantum mechanics.
The second attempt is to argue that the question is malformed. “Why” questions in ordinary life are answered by pointing to earlier causes, and causes operate within time. If time is part of the universe, there may be no “earlier” in which a cause could sit, and the question may be as meaningless as asking what lies south of the South Pole.
Neither response satisfies everyone, and neither is likely to. This is the point at which physics hands over to philosophy, and it is worth marking the handover honestly rather than pretending that a scientific answer is just around the corner.
The limits of knowing
It is worth gathering, at the end of a book like this, the things that appear to be permanently beyond reach, because they define the shape of what we can know.
There is the wall of fire of chapter 20, which blocks light from before 380,000 years, although neutrinos and gravitational waves may eventually pass it. There is the horizon, which hides everything beyond 46 billion light-years and can never be crossed. There is the fading of evidence described in chapter 21, which will eventually hide the expansion and the microwave background from future astronomers, and may already have hidden something from us. There is the Planck scale, which no conceivable accelerator can reach. And there are other bubbles, if they exist, which are unobservable by construction.
Against that, consider what has been established in the roughly four hundred years since Galileo pointed a telescope at Jupiter. The age of the universe, to within a fraction of a per cent. Its contents, in detail, including the discovery that most of it is unknown. Its geometry, its temperature at 380,000 years, its chemical composition three minutes after the beginning, the origin of every element, the existence of black holes, the presence of thousands of other worlds. The universe has turned out to be enormously stranger than anyone expected, and also far more comprehensible than anyone had a right to expect. That second fact is what Einstein found incomprehensible, and it is the more remarkable of the two.
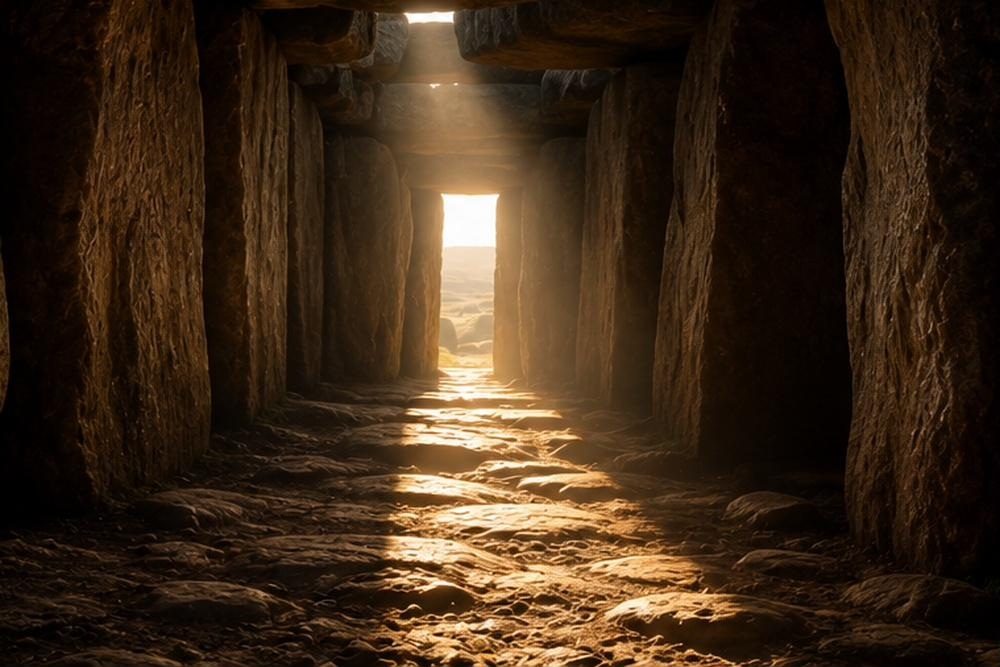
Figure F22-03. Where this book began. A beam of sunlight, five thousand years of noticing, and four centuries of measurement between that morning and this page.
Back to the passage
Return, at the end, to where this book began.
On a December morning in County Meath, a narrow beam of sunlight enters a stone passage and lies for seventeen minutes across the floor of a chamber built five thousand years ago. The people who built it knew nothing of what is in this book. They did not know that the Earth moves, or what the Sun is, or that the stars are other suns. They had no writing, no metal and no wheel.
But they had noticed something. The sunrise moves along the horizon through the year, reaches a limit, pauses and turns back. That pattern is reliable enough to build for, and they built for it with such precision that it still works after five millennia of continental drift and the slow shifting of the Earth’s tilt.
Everything in this book grew from that same act: noticing a pattern, recording it, and expecting it to hold. The tools got better, the patterns got subtler, and the distances got larger by a factor of a million million million million. But the method has not changed, and neither has the impulse behind it.
The light that enters the passage at Newgrange left the Sun’s surface eight minutes earlier. The light that JWST collects from the most distant known galaxy left it more than thirteen billion years ago, when the universe was two per cent of its present age. Both are the same substance, obeying the same rules, arriving with the same patience. In one case a Neolithic farming community caught it with a hole in a stone roof, and in the other a civilisation caught it with a gold-coated mirror unfolded a million and a half kilometres from Earth.
The universe is 13.8 billion years old, at least 93 billion light-years across, mostly made of things we cannot identify, and destined to end in darkness after a span of time that makes its present age a rounding error. It contains two trillion galaxies, and on one small planet in one ordinary galaxy, a species of ape has worked all of this out from patterns in the light, in about four centuries.
That last fact is not the least remarkable thing in this book. It may be the most.
Glossary
Terms are defined as they are used in this book. A word in italics has its own entry.
Absolute zero. The lowest possible temperature, −273.15 °C, at which a substance has no heat energy left to give up. Temperatures in cosmology are usually measured up from here.
Accretion disc. A flat, spinning disc of gas spiralling inwards onto a star or black hole, heated to enormous temperatures by friction as it falls.
Active galaxy. A galaxy whose central black hole is feeding, so that its nucleus pours out far more energy than all its stars combined. A quasar is the most extreme kind.
Andromeda galaxy. The nearest large galaxy to our own, 2.5 million light-years away; the first object proved to lie outside the Milky Way.
Anthropic argument. The observation that we can only find ourselves in a universe whose properties allow observers to exist, used to explain why certain constants of nature have life-permitting values.
Antimatter. Matter’s mirror image: for every particle there is an antiparticle with opposite charge. A particle meeting its antiparticle annihilates into radiation.
Arcsecond. One three-thousand-six-hundredth of a degree, the usual unit for small angles in astronomy. A euro coin seen from three kilometres away subtends about one arcsecond.
Astronomical unit (AU). The average distance from the Earth to the Sun, about 150 million kilometres.
Axion. A hypothetical very light particle, proposed for unrelated reasons, that is one of the leading candidates for dark matter.
Baryon acoustic oscillations. The frozen imprint of sound waves from the early universe, which leaves galaxies very slightly more likely to be separated by one particular distance. Used as a ruler to measure the expansion.
Baryon. The physicists’ collective name for protons and neutrons, and so for ordinary matter. “Baryonic matter” means atoms, as opposed to dark matter.
Big Bang. The hot, dense early state of the universe and its subsequent expansion. Not an explosion in space, and not a theory of how the universe began.
Big Crunch. A possible future in which the expansion reverses and the universe collapses back into a hot dense state.
Big Rip. A possible future in which dark energy strengthens without limit, tearing apart galaxies, stars and eventually atoms.
Binary star. Two stars in orbit around each other. About half of all stars are in such pairs, which is how stellar masses are measured.
Biosignature. A substance or pattern in a planet’s atmosphere that would indicate life, and that nothing lifeless could plausibly produce.
Blackbody. An object that glows purely because it is hot, with a characteristic spread of colours depending only on temperature. The cosmic microwave background is the most perfect one known.
Black hole. A region of spacetime so strongly curved that no path leads out of it, not even for light. Formed when a massive star’s core collapses, or by the growth of a supermassive black hole.
Blueshift. The shortening of light’s wavelength when its source approaches. See Doppler effect.
Brown dwarf. An object too heavy to be a planet and too light to sustain hydrogen fusion, so it never quite becomes a star.
Cepheid variable. A star that pulses in brightness on a regular cycle whose length reveals its true brightness, making it a standard candle. Discovered by Henrietta Leavitt.
Chandrasekhar limit. The maximum mass of a white dwarf, about 1.4 times the Sun. Above it the star collapses or detonates.
Cluster (galaxy). A gravitationally bound group of hundreds or thousands of galaxies, most of whose mass is dark matter and most of whose ordinary matter is hot gas.
Comoving distance. The present distance to a distant object, as opposed to how far its light has travelled. See light-travel distance.
Cosmic microwave background (CMB). The faint glow left over from when the universe became transparent 380,000 years after the beginning; now cooled to 2.7 degrees above absolute zero.
Cosmic web. The largest pattern in the universe: galaxies strung along filaments that meet at clusters, surrounding vast empty voids.
Cosmic ray. A high-energy particle, usually a proton, arriving from space at close to the speed of light. Cosmic rays are the main nuisance that drives dark matter detectors deep underground.
Cosmological constant. A constant energy density belonging to space itself, introduced by Einstein, discarded, and revived in 1998 as the simplest explanation of dark energy.
Cosmological principle. The assumption, now well tested, that on large enough scales the universe looks the same everywhere and in every direction.
Cosmology. The study of the universe as a whole: its origin, contents, structure and fate.
Critical density. The density of matter and energy that makes space exactly flat. The universe is measured to be at this value.
Dark ages. The period between the release of the cosmic microwave background and the first stars, when the universe was transparent but contained nothing that shone.
Dark energy. The unknown something, about 68 per cent of the universe, that is causing the expansion to accelerate.
Dark matter. Matter that has gravity but does not emit, absorb or reflect light, making up about 27 per cent of the universe. Its nature is unknown.
Degenerate matter. Matter so compressed that quantum rules about how particles may be packed provide the pressure holding it up, as in a white dwarf or neutron star.
Deuterium. Heavy hydrogen, whose nucleus contains a neutron as well as a proton. The amount left over from the first minutes measures how much ordinary matter the universe contains.
Doppler effect. The change in wavelength of waves from a moving source: shorter (bluer) when approaching, longer (redder) when receding.
Eddington limit. The maximum rate at which a black hole or star can absorb matter, set by the outward push of its own radiation.
Electromagnetic spectrum. The full range of light, from radio waves through infrared, visible light and ultraviolet to X-rays and gamma rays.
Electron. The light, negatively charged particle that surrounds an atomic nucleus.
Entropy. A measure of how unusable a system’s energy is. It always increases overall, which is why the universe runs down.
Epicycle. In Ptolemy’s system, a small circle carried around on a larger one, used to reproduce the looping motion of the planets.
Escape velocity. The speed needed to escape an object’s gravity permanently.
Eternal inflation. The idea that inflation, once started, never stops everywhere, so that bubble universes continually form within an endlessly inflating background.
Event horizon. For a black hole, the boundary beyond which nothing can escape. For the universe, the limit beyond which light emitted today will never reach us.
Exoplanet. A planet orbiting a star other than the Sun. About 6,370 are confirmed.
Expansion of space. The growth of the distances between distant galaxies, caused by space itself stretching rather than galaxies moving through it.
Fast radio burst. A flash of radio waves lasting a few thousandths of a second, arriving from other galaxies; at least some come from magnetars.
Flat (geometry). Space in which ordinary school geometry holds on the largest scales, so that the angles of a triangle add to 180 degrees. Measurements show our universe is flat to within half a per cent.
Fusion. The joining of light atomic nuclei into heavier ones, releasing energy. The power source of every star.
Galaxy. A gravitationally bound system of stars, gas, dust and dark matter, containing anything from thousands to trillions of stars.
Gamma-ray burst. An intense flash of gamma rays from a distant galaxy, produced by a collapsing massive star or a neutron star merger.
Globular cluster. A dense, roughly spherical swarm of hundreds of thousands of old stars orbiting a galaxy’s halo.
Gravitational lensing. The bending of light by gravity, which can magnify and distort the images of objects behind a massive foreground object.
Gravitational waves. Ripples in spacetime produced by accelerating masses, first detected directly in 2015 from two merging black holes.
Great Attractor. A dense concentration of mass about 250 million light-years away towards which our galaxy and its neighbours are falling.
Habitable zone. The range of distances from a star at which a planet could hold liquid water on its surface.
Great Debate. The 1920 exchange between Harlow Shapley and Heber Curtis over the size of the Milky Way and the nature of the spiral nebulae. Each was right about half of it.
Halo. The extended, roughly spherical region of dark matter, old stars and globular clusters surrounding a galaxy’s visible disc.
Hawking radiation. The faint glow a black hole emits through quantum effects at its horizon, causing it to evaporate over immense timescales.
Heat death. The end state of an ever-expanding universe: cold, thin, uniform, with no energy differences left to drive any process.
Helium. The second lightest element. About a quarter of the ordinary matter in the universe by mass, nearly all made in the first minutes.
Hertzsprung–Russell diagram. A graph of stellar brightness against temperature, on which most stars fall along the main sequence. Effectively a map of stellar lives.
Hertz. The unit of frequency: one cycle per second. Radio astronomers work in megahertz and gigahertz, millions and billions of cycles per second.
Horizon problem. The puzzle that opposite sides of the sky have the same temperature despite never having been in contact; solved by inflation.
Hubble constant. The present rate of cosmic expansion, about 67 or 73 kilometres per second per megaparsec, depending on how it is measured. See Hubble tension.
Hubble’s law. The rule that a distant galaxy’s speed of recession is proportional to its distance. Also called the Hubble–Lemaître law.
Hubble tension. The unresolved disagreement between the two most precise measurements of the Hubble constant.
Interferometry. Combining the signals from several separated telescopes so that they act as one instrument as wide as the gap between them. How the Event Horizon Telescope and gravitational-wave detectors work.
Inflation. A brief burst of enormously rapid expansion in the first fraction of a second, which explains the universe’s flatness and uniformity and seeded its structure.
Information paradox. The conflict between quantum mechanics, which forbids information being destroyed, and Hawking radiation, which appears to destroy it.
Infrared. Light of longer wavelength than red, invisible to the eye and felt as heat. The light in which the most distant galaxies are seen.
Interstellar medium. The thin gas and dust between the stars of a galaxy, from which new stars form.
Inverse-square law. The rule that brightness, or gravitational pull, falls as the square of distance: twice as far, a quarter as strong.
JWST. The James Webb Space Telescope, launched in December 2021, which observes in the infrared and has produced most of the surprises in the last few years.
Kilonova. The glow from the radioactive debris of two merging neutron stars, in which much of the universe’s gold is made.
Lambda-CDM. The standard model of cosmology: a flat universe made of dark energy (lambda), cold dark matter and ordinary matter, seeded by inflation.
Laniakea. The supercluster of galaxies in which the Milky Way sits, about 500 million light-years across, defined by the flow of galaxies towards a common centre.
Light-travel distance. The distance light has covered in reaching us, equal to its travel time multiplied by the speed of light. Smaller than the comoving distance for distant objects.
Light-year. The distance light travels in one year, about 9.5 trillion kilometres.
Little red dots. Compact, very red objects found by JWST in the early universe, now thought to be young black holes wrapped in dense gas.
Local Group. The gravitationally bound group of galaxies containing the Milky Way, Andromeda and about eighty smaller companions.
Magnetar. A neutron star with an extraordinarily strong magnetic field, capable of enormous flares.
Main sequence. The band on the Hertzsprung–Russell diagram occupied by stars fusing hydrogen in their cores, which is most of them, including the Sun.
Magnitude. The old astronomical brightness scale, in which smaller numbers mean brighter objects and five magnitudes correspond to a factor of a hundred in brightness.
Metallicity. The proportion of elements heavier than helium in a star or gas cloud. Astronomers call all such elements “metals”, to the annoyance of chemists.
Megaparsec. A million parsecs, about 3.26 million light-years. The usual unit for distances between galaxies.
Microlensing. A brief brightening of a background star as a foreground object’s gravity focuses its light; used to find planets far from their stars.
Milky Way. Our own galaxy: a barred spiral about 100,000 light-years across containing a few hundred billion stars.
MOND. Modified Newtonian Dynamics, the proposal that gravity behaves differently where it is very weak, offered as an alternative to dark matter.
Multiverse. The idea that our universe is one of many, each with possibly different physical laws; a consequence of eternal inflation.
Nebula. A cloud of gas and dust in space. Historically the word also covered galaxies, before they were understood.
Neutrino. An almost massless particle that barely interacts with matter. Vast numbers stream from the Sun and from the first second of the universe.
Neutron star. The collapsed core left by a supernova: about twenty kilometres across, with more mass than the Sun.
Nucleosynthesis. The building of atomic nuclei. Big Bang nucleosynthesis made the lightest elements; stellar nucleosynthesis makes the rest.
Olbers’ paradox. The puzzle of why the night sky is dark if the universe is infinite and eternal. Its answer is that the universe has a finite age.
Parallax. The apparent shift of a nearby star against distant ones as the Earth moves around the Sun; the only direct geometric measure of stellar distance.
Radial velocity. The speed of an object directly towards or away from us, measured from the Doppler effect on its spectral lines.
Parsec. The distance at which a star shows a parallax of one second of arc, about 3.26 light-years.
Photon. A particle of light.
Planck scale. The extremely small length (10⁻³⁵ metres) and time (10⁻⁴³ seconds) at which quantum effects on gravity become unavoidable and current theory fails.
Planetary nebula. The glowing shell of gas shed by a dying Sun-like star. Nothing to do with planets.
Plasma. A gas hot enough that its atoms have been stripped of electrons. The state of the universe before 380,000 years, and of the interiors of stars.
Population III stars. The first generation of stars, formed from hydrogen and helium alone, with no heavier elements. None has yet been observed.
Proton decay. The hypothetical and never-observed decay of protons, which if real would dissolve all ordinary matter over about 10³⁴ years.
Pulsar. A rapidly spinning neutron star whose beams of radio waves sweep past the Earth, producing extremely regular pulses.
Pulsar timing array. A network of precisely monitored pulsars used as a galaxy-sized detector of very long gravitational waves.
Quantum gravity. The missing theory that would describe gravity and quantum mechanics together. String theory and loop quantum gravity are the main attempts.
Quasar. An extremely luminous active galaxy nucleus in the distant, early universe, powered by a feeding supermassive black hole.
Recombination. The moment 380,000 years after the beginning when nuclei and electrons combined into atoms and the universe became transparent.
Red dwarf. A small, cool, dim, long-lived star. The commonest kind in the galaxy.
Red giant. An ageing star that has exhausted the hydrogen in its core and swollen enormously while cooling at the surface.
Redshift. The stretching of light to longer wavelengths, either by motion away from us or, for distant galaxies, by the expansion of space during the light’s journey. Written z.
Reionisation. The period, ending about a billion years after the beginning, when radiation from the first stars and quasars stripped electrons off the hydrogen between galaxies.
Relativity, general. Einstein’s 1915 theory in which gravity is the curving of spacetime by mass and energy.
Relativity, special. Einstein’s 1905 theory, based on the speed of light being the same for all observers, from which time dilation and E = mc² follow.
Rotation curve. A graph of orbital speed against distance from a galaxy’s centre. Its flatness is the main evidence for dark matter in galaxies.
Schwarzschild radius. The size to which a mass must be compressed to become a black hole: about 3 kilometres for the Sun, 9 millimetres for the Earth.
SETI. The search for extraterrestrial intelligence, chiefly by listening for radio or optical signals.
Sigma. A measure of how far a result lies from expectation, in units of its own uncertainty. Five sigma is the usual threshold for claiming a discovery.
Solar mass. The mass of the Sun, 2 × 10³⁰ kilograms, used as the unit for weighing stars, black holes and galaxies.
Singularity. A point where a theory gives infinite values, as at the centre of a black hole or at time zero. Generally taken as a sign that the theory has broken down.
Sound horizon. The distance sound waves travelled in the early universe before recombination froze them; used as a standard ruler.
Spiral galaxy. A flattened, rotating galaxy with arms, usually still forming stars, like the Milky Way. Contrast with an elliptical galaxy, a smooth ball of old stars.
Spectroscopy. The splitting of light into its colours to read the pattern of lines that reveals composition, temperature and motion.
Spectrum. The spread of light by wavelength. Dark or bright lines in it identify the elements present.
Standard candle. An object whose true brightness is known, so that its apparent brightness gives its distance. Cepheid variables and Type Ia supernovae are the main ones.
Star cluster. A group of stars formed together from the same cloud; useful for measuring ages.
Steady state theory. The rival to the Big Bang, in which the universe is eternal and unchanging, with new matter continually created. Abandoned after 1965.
Stellar wind. The stream of particles flowing off a star’s surface, by which stars shed mass over their lifetimes.
String theory. An attempt at quantum gravity in which fundamental particles are tiny vibrating strings, requiring extra spatial dimensions.
Supercluster. A large, unbound association of galaxy clusters and groups, such as Laniakea.
Supermassive black hole. A black hole of millions to billions of solar masses, found at the centre of nearly every large galaxy.
Supernova. The explosive death of a star. Core-collapse supernovae end massive stars; Type Ia supernovae are detonating white dwarfs.
Surface of last scattering. The shell, at the limit of what light can show us, from which the cosmic microwave background was released. Sometimes called the wall of fire.
21-centimetre line. Radio emission from cold hydrogen gas, the main hope for mapping the dark ages. Stretched by expansion to metre wavelengths by the time it reaches us.
Technosignature. Evidence of technology rather than of life itself, such as industrial gases or waste heat.
Tidal force. The difference in gravitational pull across an object, which raises tides on Earth and would stretch a falling body near a black hole.
Topology. The question of how space is connected on the largest scales: whether it goes on forever, or wraps around on itself so that a straight line eventually returns to its starting point.
Transit. The passage of a planet in front of its star, producing a small dip in brightness that reveals the planet’s size.
Type Ia supernova. The detonation of a white dwarf pushed past the Chandrasekhar limit. Always about equally bright, making it the standard candle that revealed dark energy.
Vacuum energy. The energy that quantum theory says empty space possesses; the natural candidate for dark energy, though theory overestimates it by a factor of 10¹²⁰.
Void. An enormous, nearly empty region of the cosmic web, tens or hundreds of millions of light-years across.
Vacuum decay. The possibility that our apparently empty space is not in its lowest-energy state and could, with no warning, tunnel into a lower one, changing the laws of physics as the change spreads at the speed of light.
Wavelength. The distance between successive crests of a wave. For light it determines colour.
Weak lensing. The slight, statistical distortion of the shapes of many background galaxies by intervening mass; used to map dark matter.
White dwarf. The Earth-sized ember left when a Sun-like star dies, held up by degenerate matter and cooling forever.
WIMP. Weakly Interacting Massive Particle, for thirty years the favoured candidate for dark matter, still not detected.
Wormhole. A hypothetical tunnel connecting distant parts of spacetime. Allowed by the equations, never observed, and probably unstable.
Zone of Avoidance. The band of sky along the Milky Way’s disc where dust hides the galaxies beyond.
Timeline of Discoveries
Dates before about 1500 are approximate, and some are disputed. Entries in bold mark the turning points.
Before the telescope
- c. 3200 BCE — The passage tomb at Newgrange is built in the Boyne valley, aligned so that the midwinter sunrise reaches the chamber.
- c. 2500 BCE — The great stone circle at Stonehenge takes shape, aligned on the midsummer sunrise.
- c. 1600 BCE — Babylonian scribes record the risings and settings of Venus on clay tablets.
- c. 700 BCE — Babylonian astronomers begin the astronomical diaries, a nightly record kept for some six centuries.
- c. 600 BCE — The thinkers of Miletus begin explaining nature by rules rather than by gods.
- c. 500 BCE — The followers of Pythagoras declare the Earth a sphere.
- c. 350 BCE — Aristotle gives observational evidence for a spherical Earth, and sets out a cosmos of nested crystal spheres.
- c. 270 BCE — Aristarchus of Samos measures the relative sizes of the Sun and Moon and proposes that the Earth orbits the Sun.
- c. 240 BCE — Eratosthenes measures the circumference of the Earth using a shadow and a distance.
- c. 130 BCE — Hipparchus catalogues the stars and discovers the precession of the equinoxes.
- c. 150 CE — Ptolemy completes the Almagest, whose epicycles predict planetary positions for the next fourteen centuries.
- 9th century — The House of Wisdom in Baghdad translates and extends Greek astronomy.
- 964 — Al-Sufi records a “little cloud” in Andromeda: the first written notice of another galaxy.
- c. 900 — Al-Battani improves the measured length of the year and the rate of precession.
- 1259 — The Maragha observatory is founded; al-Tusi devises the geometry later echoed by Copernicus.
- 1420s — Ulugh Beg builds his observatory at Samarkand and compiles the first major new star catalogue since Ptolemy.
The Copernican revolution
- 1543 — Copernicus publishes On the Revolutions of the Heavenly Spheres in the year of his death.
- 1572 — Tycho Brahe observes a new star in Cassiopeia and shows it lies beyond the Moon.
- 1576 — Thomas Digges publishes a Copernican diagram with the stars scattered without limit.
- 1577 — Tycho shows that a comet passes through the region of the supposed crystal spheres.
- 1600 — Giordano Bruno is burned in Rome, having argued among much else that the stars are suns with worlds.
- 1609 — Kepler publishes the first two laws of planetary motion; Galileo builds his first telescope.
- 1610 — Galileo publishes The Starry Messenger: mountains on the Moon, four moons of Jupiter, countless stars in the Milky Way.
- 1610 — Galileo observes the full cycle of phases of Venus, which Ptolemy’s system cannot produce.
- 1619 — Kepler publishes the third law, linking a planet’s distance from the Sun to the length of its year.
- 1627 — Kepler’s Rudolphine Tables reduce planetary prediction errors roughly thirtyfold.
- 1633 — Galileo is tried by the Roman Inquisition and placed under house arrest.
The clockwork heavens
- 1655 — Christiaan Huygens identifies the rings of Saturn.
- 1676 — Ole Rømer, timing the moons of Jupiter, shows that light travels at a finite speed.
- 1687 — Newton publishes the Principia: three laws of motion and one law of universal gravitation.
- 1705 — Halley predicts the return of the comet that now bears his name.
- 1729 — James Bradley discovers the aberration of starlight: the first direct evidence that the Earth moves.
- 1755 — Kant proposes that some nebulae are separate “island universes”.
- 1758 — Halley’s comet returns on schedule, sixteen years after his death.
- 1761, 1769 — International expeditions observe the transits of Venus and measure the scale of the solar system.
- 1774 onward — Messier publishes his catalogue of objects that are not comets.
- 1781 — William Herschel discovers Uranus, the first planet found in recorded history.
- 1783 — John Michell describes stars so massive that light could not escape them.
- 1785 — Herschel maps the shape of the Milky Way by counting stars.
- 1798 — Henry Cavendish measures the strength of gravity, and so the mass of the Earth.
- 1800 — Herschel discovers infrared radiation.
- 1802 — William Hyde Wollaston notices dark lines in the solar spectrum.
- 1814 — Joseph Fraunhofer maps 574 dark lines in sunlight and finds them in stars too.
- 1823 — Olbers restates the puzzle of why the night sky is dark.
- 1838 — Friedrich Bessel measures the parallax of 61 Cygni: the first distance to a star.
- 1845 — The third Earl of Rosse completes the Leviathan at Birr and sees spiral structure in Messier 51.
- 1846 — Neptune is found within a degree of the position calculated by Le Verrier and Adams.
Starlight read
- 1859 — Kirchhoff and Bunsen show that each element leaves a unique fingerprint in a spectrum.
- 1864 — William Huggins finds that some nebulae are glowing gas and others look like assemblies of stars.
- 1868 — Helium is identified in the Sun, twenty-seven years before it is found on Earth; Huggins measures a star’s motion by its redshift.
- 1885 — A star flares in the Andromeda nebula, later understood to be a supernova.
- 1888 — J. L. E. Dreyer publishes the New General Catalogue, compiled at Armagh.
- 1890s onward — The Harvard computers classify hundreds of thousands of stellar spectra.
- 1905 — Einstein publishes special relativity, and E = mc².
- 1912 — Henrietta Leavitt publishes the period–brightness relation for Cepheid variables.
- 1912 onward — Vesto Slipher finds that most spiral nebulae are receding.
- 1915 — Einstein publishes general relativity; Schwarzschild solves its equations for a spherical mass.
- 1917 — Einstein adds the cosmological constant to keep the universe static.
- 1918 — Harlow Shapley shows that the Sun lies far from the centre of the Milky Way.
- 1919 — Eddington’s eclipse expeditions measure the bending of starlight and make Einstein famous.
- 1920 — The Great Debate between Shapley and Curtis on the scale of the universe.
- 1922 — Alexander Friedmann finds expanding solutions to Einstein’s equations.
- 1923 — Edwin Hubble identifies a Cepheid in the Andromeda nebula and proves it lies outside the Milky Way.
- 1925 — Cecilia Payne shows that stars are made overwhelmingly of hydrogen.
- 1927 — Georges Lemaître derives the expanding universe and predicts a distance–velocity relation.
- 1929 — Hubble and Humason publish the velocity–distance relation.
- 1930 — Subrahmanyan Chandrasekhar derives the mass limit for a white dwarf.
- 1930 — Robert Trumpler proves that interstellar dust dims and reddens starlight.
- 1931 — Lemaître proposes the primeval atom: a day without a yesterday.
- 1933 — Fritz Zwicky finds that the Coma cluster contains far more mass than can be seen.
- 1933 — Karl Jansky detects radio waves from the centre of the Milky Way.
- 1934 — Baade and Zwicky propose that supernovae leave neutron stars behind.
- 1934 — William McCrea and Edward Milne derive the expanding universe from Newtonian gravity.
- 1938 — Ernst Öpik, later of Armagh, works out how ageing stars become red giants.
- 1939 — Oppenheimer and Snyder show that a massive collapsing star must contract without limit.
The Big Bang established
- 1948 — Alpher and Gamow calculate the making of the light elements; Alpher and Herman predict a leftover radiation of a few degrees.
- 1948 — Bondi, Gold and Hoyle propose the steady state theory.
- 1949 — Hoyle coins the name “Big Bang” in a BBC broadcast.
- 1952 — Walter Baade corrects the distance scale, doubling the size of the known universe.
- 1953 — Hoyle predicts the carbon resonance needed for stars to build heavy elements; it is found.
- 1957 — Burbidge, Burbidge, Fowler and Hoyle set out how stars make the elements.
- mid-1950s — Martin Ryle’s radio source counts show that the distant past was different.
- 1963 — Maarten Schmidt measures the redshift of quasar 3C 273.
- 1965 — Penzias and Wilson detect the cosmic microwave background; Dicke’s group explains it.
- 1965 — Penrose proves that gravitational collapse leads generically to a singularity.
- 1967 — Jocelyn Bell discovers the first pulsar; Wheeler popularises the name “black hole”.
- 1971 — Cygnus X-1 becomes the first strong black-hole candidate.
- 1974 — Hulse and Taylor find the binary pulsar, later proving gravitational waves exist.
- 1974 — Hawking shows that black holes radiate and slowly evaporate.
- 1970s — Vera Rubin and Kent Ford measure flat rotation curves in galaxy after galaxy.
- 1980 — Alan Guth proposes inflation; Starobinsky had published a related model the same year.
- 1982 — Quantum fluctuations during inflation are shown to seed cosmic structure.
- 1983 — Mordehai Milgrom proposes MOND as an alternative to dark matter.
- 1983 — Hartle and Hawking propose the no-boundary condition.
- 1987 — Supernova 1987A explodes; neutrinos are detected three hours before the light.
- 1987 — Weinberg predicts, on anthropic grounds, a small but non-zero cosmological constant.
Precision cosmology
- 1992 — COBE finds the ripples in the microwave background; the first exoplanets are found around a pulsar.
- 1995 — Mayor and Queloz discover a hot Jupiter orbiting 51 Pegasi.
- 1998 — Two teams find that the expansion of the universe is accelerating.
- 2003 onward — WMAP maps the microwave sky and fixes the age of the universe near 13.7 billion years.
- 2006 — The Bullet Cluster shows dark matter separated from ordinary matter after a collision.
- 2009 — The Kepler telescope launches and begins finding thousands of planets.
- 2013 — Planck’s first cosmology results give an expansion rate near 67, and the Hubble tension begins to open.
- 2014 — BICEP2 announces a detection of inflationary gravitational waves; it turns out to be dust.
- 2014 — The Laniakea supercluster is defined by the flow of galaxies.
- 2015 — LIGO detects gravitational waves from two merging black holes.
- 2017 — Two neutron stars are seen to merge in gravitational waves and in light, and are found to forge gold.
- 2018 — Planck’s final results; Ireland joins the European Southern Observatory.
- 2019 — The Event Horizon Telescope photographs the shadow of the black hole in M87.
- 2020 — Nobel Prizes to Penrose, Genzel and Ghez for black holes.
- 2021 — The James Webb Space Telescope is launched on Christmas Day.
- 2022 — The Event Horizon Telescope images Sagittarius A*, at the centre of our own galaxy.
- 2022 onward — JWST finds galaxies brighter and earlier than expected, and the little red dots.
- 2023 — Four pulsar timing collaborations report a background hum of gravitational waves; Euclid launches.
- 2024 — DESI’s first results hint that dark energy may not be constant.
- 2024 — Freedman’s group, using JWST, finds expansion rates near 70 from red giants and carbon stars.
- 2025 — DESI’s three-year analysis strengthens the hint of evolving dark energy; Rubin Observatory releases its first images.
- 2026 — Rubin issues its first public alerts in February and begins the ten-year survey in June.
- 2026 — A network analysis of all local distance methods gives an expansion rate of 73.5, deepening the Hubble tension.
- 2026 — Evidence converges on the little red dots being young black holes in dense gas cocoons.
- 2026 — The Nancy Grace Roman Space Telescope is launched on 30 August.
Expected next
- 2026–2027 — Euclid’s first survey data release; Roman begins observing.
- 2027 — DESI’s full five-year analysis: whether dark energy is constant.
- Late 2020s — The Simons Observatory’s deep search for the fingerprint of inflation; the first maps of the cosmic dark ages by the Square Kilometre Array.
- 2030s — The Extremely Large Telescope, LiteBIRD, the next generation of gravitational-wave detectors, and LISA.
The Scale of the Universe
Everything in this book, from the smallest length physics can describe to the largest distance light can have travelled, on one scale. Sizes are given in metres as powers of ten: 10³ is a thousand metres, 10⁻³ is a thousandth of a metre. Each step down the table is ten times larger than the one before.
From the smallest to the largest
| Size in metres | What it is | A comparison |
|---|---|---|
| 10⁻³⁵ | the Planck length | the smallest length physics can describe; below this, spacetime itself is uncertain |
| 10⁻¹⁸ | a quark, as far as anyone can tell | no experiment has yet found it to have any size at all |
| 10⁻¹⁵ | an atomic nucleus | a fly in a cathedral, if the cathedral is the atom |
| 10⁻¹⁰ | an atom | five million laid end to end would cross a fingernail |
| 10⁻⁹ | a strand of DNA, across | a nanometre |
| 10⁻⁷ | a virus, or the wavelength of blue light | |
| 10⁻⁵ | a human cell | just at the limit of unaided sight |
| 10⁻³ | a grain of sand | a millimetre |
| 10⁰ | a person | one metre |
| 10⁴ | a city, or the height of cruising aircraft | ten kilometres; also the size of a neutron star |
| 10⁶ | Ireland, end to end | about 500 kilometres |
| 10⁷ | the Earth | 12,700 kilometres across |
| 10⁸ | Jupiter | eleven Earths across |
| 10⁹ | the Sun | 1.4 million kilometres across; a hundred and nine Earths |
| 10¹¹ | the Earth’s orbit | 150 million kilometres in radius: one astronomical unit |
| 10¹³ | the orbit of Neptune | thirty astronomical units; light takes four hours to cross |
| 10¹⁶ | the nearest star system, Alpha Centauri | 4.2 light-years |
| 10¹⁸ | the nearest star-forming nebula | a few hundred light-years |
| 10²⁰ | the distance to the centre of the Milky Way | 26,000 light-years |
| 10²¹ | the Milky Way | 100,000 light-years across |
| 10²² | the distance to the Andromeda galaxy | 2.5 million light-years |
| 10²³ | the Local Group | about 10 million light-years across |
| 10²⁴ | the Virgo Cluster, and its distance from us | about 55 million light-years |
| 10²⁵ | the Laniakea supercluster | about 500 million light-years across |
| 10²⁶ | the observable universe | 93 billion light-years across, or 8.8 × 10²⁶ metres |
Times
| Time in seconds | What it is |
|---|---|
| 10⁻⁴³ | the Planck time: the earliest moment physics can describe |
| 10⁻³⁵ | inflation |
| 10⁻⁶ | protons and neutrons form |
| 10⁰ | one second: neutrinos fly free |
| 10² | three minutes: hydrogen and helium are forged |
| 10¹³ | 380,000 years: the universe becomes transparent |
| 10¹⁵ | 100 million years: the first stars |
| 10¹⁷ | 4.6 billion years: the age of the Sun |
| 10¹⁷ | 13.8 billion years: the age of the universe (4.35 × 10¹⁷ seconds) |
| 10²² | 100 trillion years: the last stars go out |
| 10³⁰ | black holes begin to dominate |
| 10¹⁰⁸ | the last supermassive black hole evaporates |
Masses
| Mass in kilograms | What it is |
|---|---|
| 10⁻³⁰ | an electron |
| 10⁻²⁷ | a proton, or a hydrogen atom |
| 10² | a person |
| 10¹² | a large hill |
| 10²¹ | a large asteroid |
| 10²⁵ | the Earth (6 × 10²⁴ kg) |
| 10²⁷ | Jupiter |
| 10³⁰ | the Sun (2 × 10³⁰ kg), the standard unit for weighing stars |
| 10³¹ | a neutron star: more than the Sun, in a ball 20 km across |
| 10³⁷ | the black hole at the centre of the Milky Way: four million Suns |
| 10⁴² | the Milky Way, including its dark matter |
| 10⁴⁵ | a large galaxy cluster |
| 10⁵³ | all the ordinary matter in the observable universe |
Useful numbers
| Quantity | Value |
|---|---|
| Speed of light | 299,792 kilometres per second |
| Light-year | 9.46 × 10¹² kilometres |
| Parsec | 3.26 light-years |
| Astronomical unit | 149.6 million kilometres |
| Age of the universe | 13.8 billion years |
| Radius of the observable universe | 46 billion light-years |
| Temperature of the microwave background | 2.725 degrees above absolute zero |
| Expansion rate (Hubble constant) | 67 or 73 km/s per megaparsec, disputed |
| Composition of the universe | 5% ordinary matter, 27% dark matter, 68% dark energy |
| Age of the Sun | 4.6 billion years; about 5 billion remaining |
| Distance to the galactic centre | 26,000 light-years |
| Time for the Sun to orbit the galaxy | 230 million years |
| Number of galaxies in the observable universe | roughly two trillion |
| Confirmed planets around other stars | about 6,370, and rising weekly |
Two ways to feel the scale
The universe as the Earth. Shrink the observable universe until it is the size of the Earth. The Milky Way becomes a house, fourteen metres across. The Local Group is a kilometre and a half. The Laniakea supercluster is a county, seventy kilometres across. The solar system out to Neptune is the size of a virus, and the Sun itself is smaller than a single hydrogen atom.
The universe as a year. Compress all 13.8 billion years into one calendar year. The first stars light up on 5 January. The Milky Way’s disc takes shape in mid-March. The Sun and Earth form on 1 September, and the first life appears three weeks later. Animals arrive on 17 December, the dinosaurs die on 30 December, and modern humans appear twenty minutes before midnight on 31 December. Newgrange is built twelve seconds before midnight, and everything from Galileo’s telescope to the Webb Space Telescope happens in the final second.